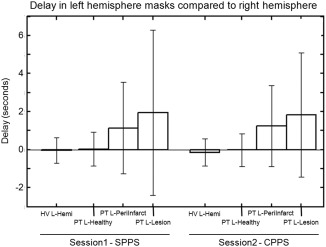
Figure 3.

Using the VoxOpt analysis, the delay between each individual voxel time series and the end‐tidal CO2 time series can be calculated. With the assumption that the right hemisphere masks are largely unaffected by the stroke, the delay in the left hemisphere masks compared with their right homologous regions are shown for both the SPPS and CPPS time points (bars show means, error bars show standard deviations).
