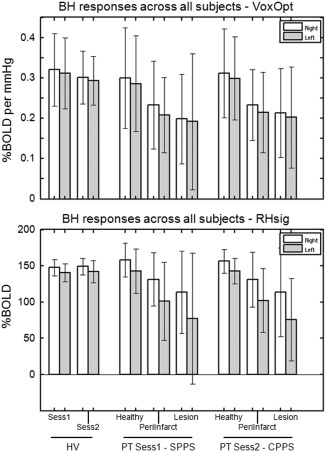
Figure 4.

Breath‐hold responses averaged across participants (bars show means, error bars show standard deviations). The top panel displays results from the VoxOpt analysis and the bottom panel shows results from the RHsig analysis. White bars show results from masks in the right hemisphere and grey bars show results from the left hemisphere masks. For the HV group, whole hemisphere masks were used. For the PT group at the two time points (Sess1‐SPPS and Sess2‐CPPS), results from three masks in each hemisphere are shown: Healthy, PeriInfarct and Lesion.
