
Figure 2.
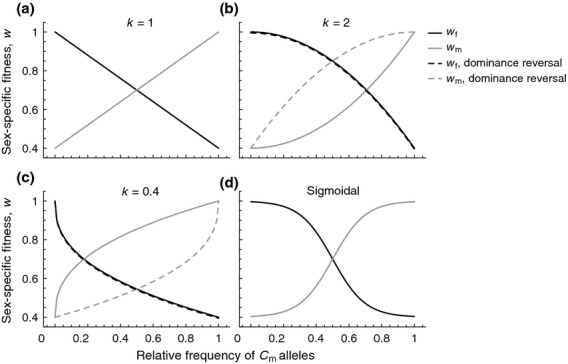
Male and female fitnesses when individuals contain more than a single cytoplasmic element. For all panels, solid lines indicate a scenario of ’constant dominance’ where the fitness gain in one sex is exactly mirrored by the fitness loss in the other sex. Dashed lines indicate a scenario of ’reverse dominance’, where the fitness gain in one sex is different from the fitness loss in the other sex. (a) k = 1, sex-specific fitness changes linearly with the proportion of  mitochondria in both males and females. (b, c) sex-specific fitness changes either in an accelerating or decelerating fashion with an increasing proportion of
  mitochondria. See Table 1 for formal descriptions of the different fitness functions. (d) sex-specific fitness changes in a sigmoidal fashion. Parameters for all panels:
  . Panel (d) k = 0.1.