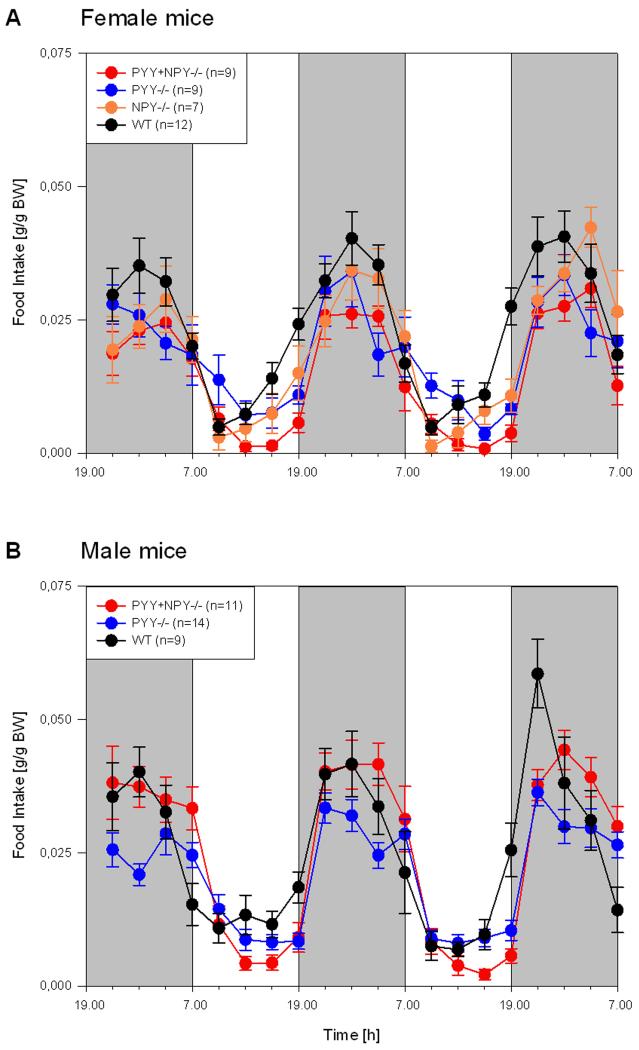
Figure 7.
Time course of circadian food intake in female (A) and male (B) WT, PYY−/−, PYY+NPY−/− and NPY−/− mice. The graphs show the food consumption summed up at intervals of 3 h for three consecutive dark phases (shaded areas, experimental days 0, 1 and 2) and two intervening light phases (white areas, experimental days 1 and 2). Food consumption is expressed as g/g BW. The values represent means ± SEM, n as indicated in brackets.

