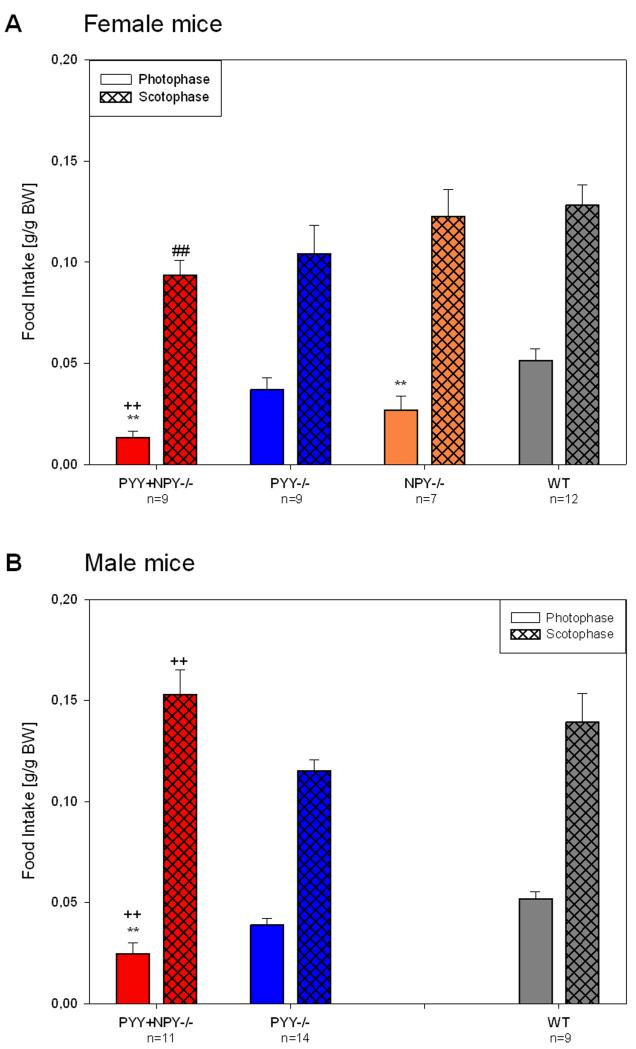
Figure 9.
Quantitative estimates of food intake during the photo- and scotophase in female (A) and male (B) WT, PYY−/−, PYY+NPY−/− and NPY−/− mice. The bars represent the food consumption summed up and averaged for the photophase and scotophase, respectively, of experimental days 1 and 2. Food consumption is expressed as g/g BW. The values represent means ± SEM, n as indicated below the abscissa. ** P ≤ 0.05 vs. WT mice of the same gender, ++ P ≤ 0.05 vs. PYY−/− mice of the same gender (one-way ANOVA); ## P ≤ 0.05 vs. male mice of the same genotype (two-sample t-test).

