Figure 1.

ROC curve - Swanson metacarpophalangeal arthroplasty for rheumatoid arthritis
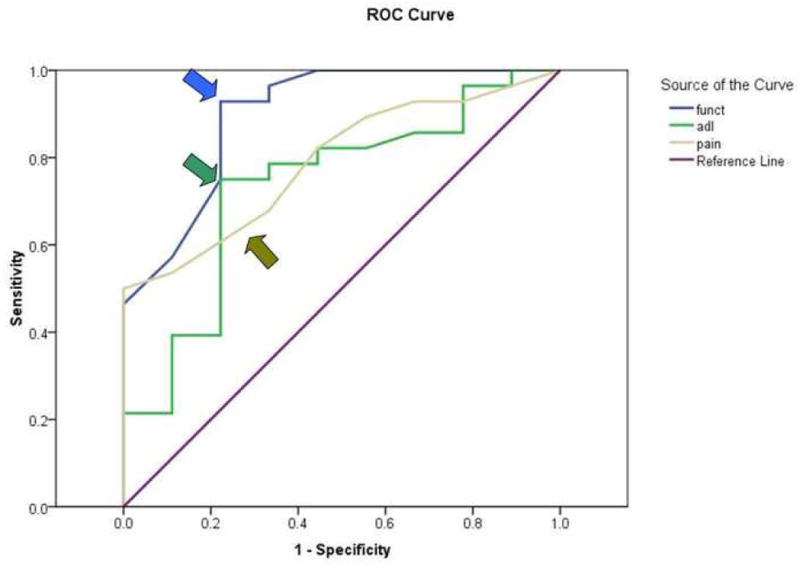
Arrows indicate the MCIDs, the points closest to the upper left quadrant of the graph, where sensitivity is closest to 1 and 1-specificity is closest to 0.

ROC curve - Swanson metacarpophalangeal arthroplasty for rheumatoid arthritis
Arrows indicate the MCIDs, the points closest to the upper left quadrant of the graph, where sensitivity is closest to 1 and 1-specificity is closest to 0.