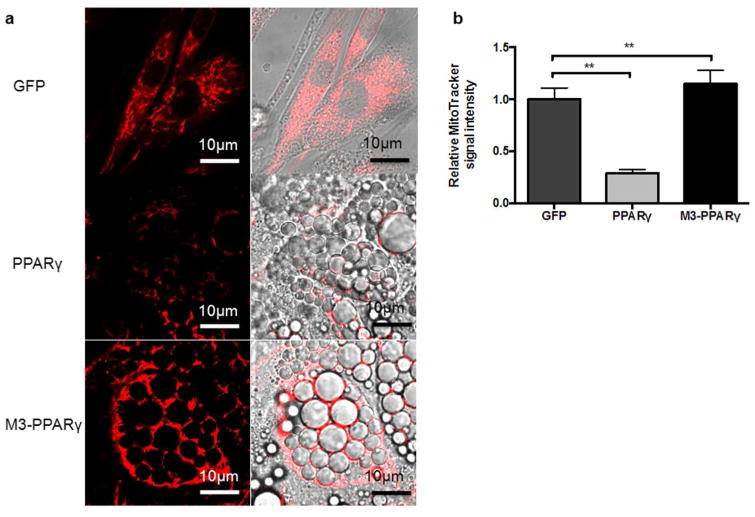
Figure 6.

Induction of mitobiogenesis by M3-PPARγ. (a) Representative image of MitoTracker (red) staining of human myoblasts transduced with GFP, PPARγ and M3-PPARγ 11 days after treatment of adipose differentiation. (b) Quantitative fluorescence signal of MitoTracker staining. Data are presented as mean ± SEM; **p < 0.01 versus PPARγ (n = 10). Scale bar: 10 μm for all images.
