
Figure 1.
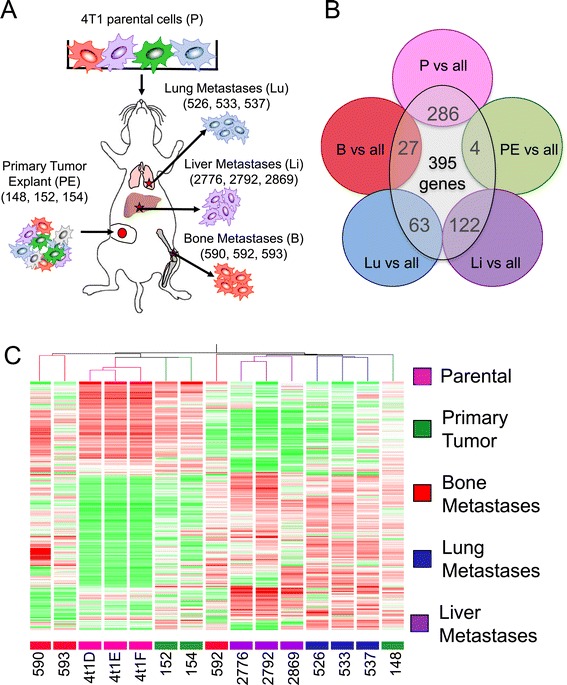
Gene expression profiling reveals distinct expression patterns associated with different metastatic 4T1 subpopulations. (A) Schematic depicting 4T1-derived breast cancer cell populations isolated from distinct metastatic sites. (B) To identify candidate genes that were differentially expressed among the isolated populations, each group (parental cell line and the explants derived from mammary fat pad (PE), bone, lung and liver metastases) was individually compared to all the other groups. A two-fold change cutoff was determined and 395 differentially expressed genes were selected using a nonparametric test coupled with a 5% false discovery rate. (C) A heatmap displaying the hierarchical clustering of isolated 4T1-derived cell populations using the 395 differentially expressed genes. Red color indicates those genes that are highly expressed and the green color denotes those genes that are underexpressed. The majority of cell populations clustered according to the site from which they were derived.