
Figure 1.
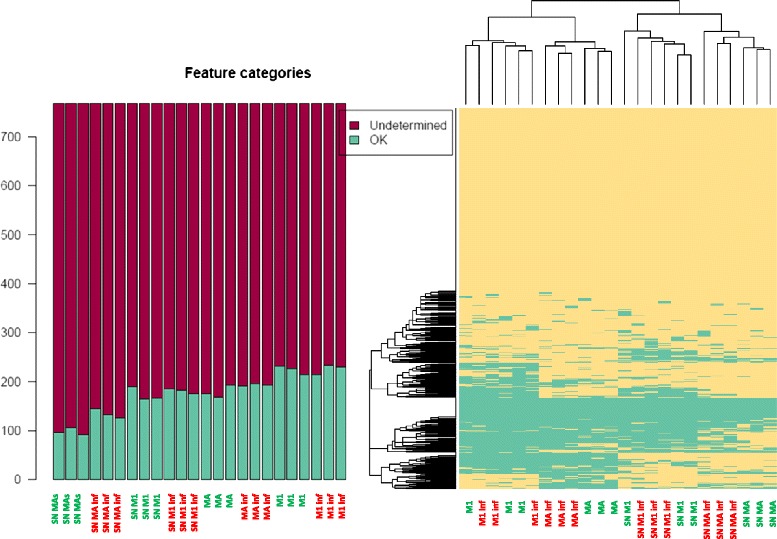
MicroRNA profiles and cluster analysis. MicroRNA profiles in cells and their supernatants (SN) after removing Ct values ≥35, and cluster analysis according to the quality of all determinations. Green (controls) for differentiated adipocytes (MAs) and M1 macrophages (M1) cultured under normal conditions. Inflamed (Inf) cells are shown in red.