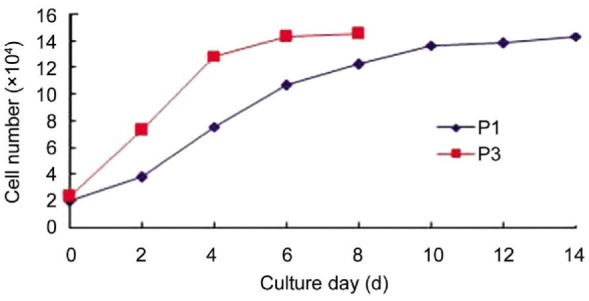
Figure 2. Growth curves of hUC-MSCs.

The growth characteristics of hUC-MSCs were compared between passage 1 (P1) and passage 3 (P3). There were significant differences in growth kinetics during the culture period. After 5d, a plateau of P3 in the growth was reached while that of P1 occurred after 12d of culture.
