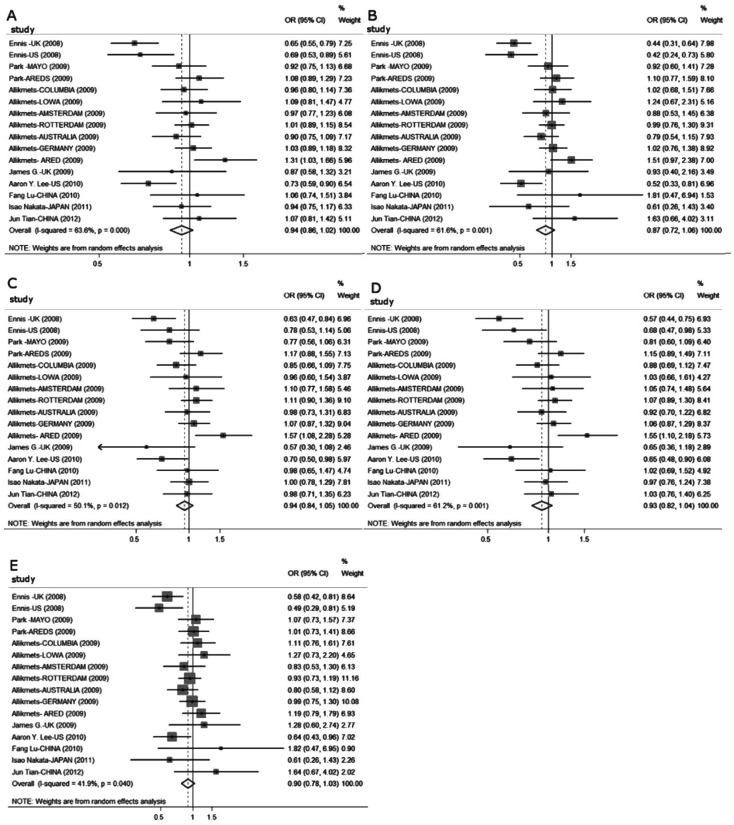
Figure 2. Forest plots for association between the SERPING1 rs2511989 polymorphism and AMD in different genetic models.
The size of the square indicates the relative weight of each study. Bars: 95% confidence interval (95%CI). A: Allele model (A vs G); B: Homozygote model (AA vs GG); C: Heterozygote model (AG vs GG); D: Dominant model (AA+AG vs GG); E: Recessive model (AA vs AG+GG).

