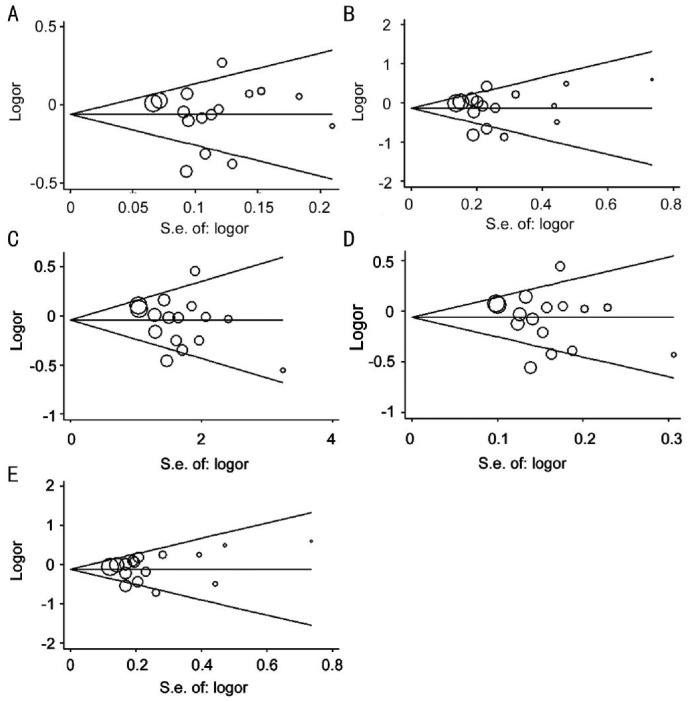
Figure 6. Begg's funnel plot for publication bias test under five genetic models.
A: A vs G; B: AA vs GG; C: AG vs GG; D: AA+AG vs GG; E: AA vs AG+GG; Each circle represented a separate study for the indicated association, and its size was proportional to the sample size of each study. The shapes of the funnel plots did not reveal any evidence of obvious asymmetry.

