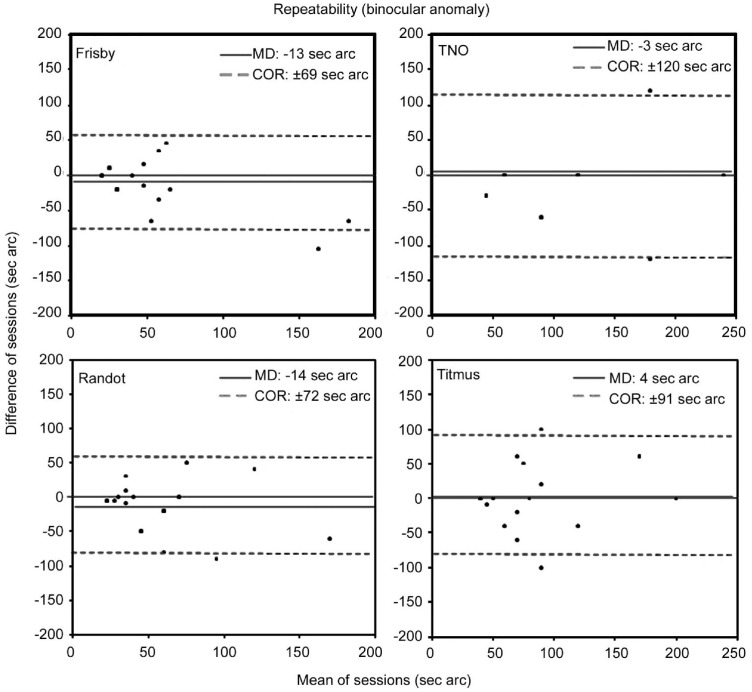
Figure 2. Bland-Altman plots of the repeatability of stereoacuity measurements taken in subjects with abnormal binocular vision.
The solid line represents the averaged difference between final session and initial session measures (MD: mean difference). Dotted lines indicate the lower and upper 95% limits of agreement (coefficient of repeatability, COR=±1.96×SD) (Wilcoxon test P>0.05).

