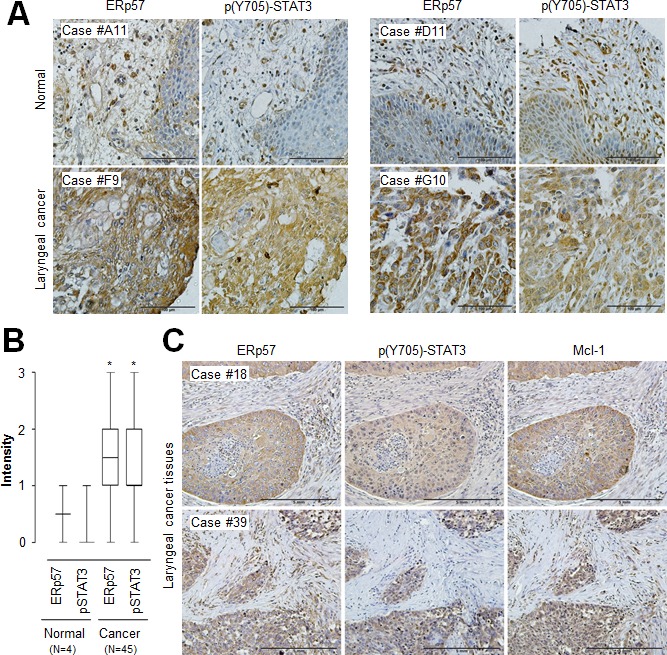
Figure 5. Correlation of ERp57, STAT3, and Mcl-1 expression levels in laryngeal cancer tissues.

(A) Representative microscopic images of laryngeal cancers and their normal tissue counterpart sections stained with anti-ERp57 antibody (left panels) and anti-phospho-STAT3 (Tyr705) antibody (right panels). Scale bar, 100 μm. (B) Quantification of ERp57 and phospho-STAT3 (Tyr705) staining intensities in laryngeal cancers (n = 45) and normal tissues (n = 4). Staining intensity was scored as follows: 0, no staining; +1, weak; +2, moderate; and +3, strong. Data are presented as box-and-whisker plots. *P < 0.05 compared with staining intensity of normal tissues. (C) Representative microscopic images of laryngeal cancer tissue sections stained with anti-ERp57 antibody (left panel), anti-phospho-STAT3 (Tyr705) antibody (middle panel), or anti-Mcl-1 antibody (right panel). Scale bar, 5 mm.
