
Figure 6. Association between the ERp57-STAT3 interaction and poor prognosis in laryngeal cancer.
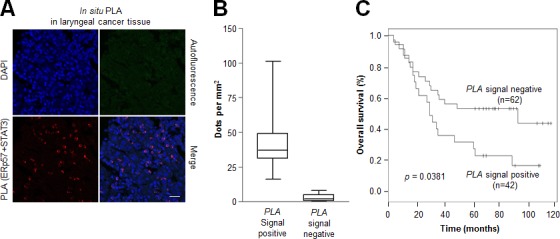
Tissue sections (n = 106) were incubated with rabbit anti-ERp57 antibody and mouse anti-STAT3 antibody, followed by in situ PLA analysis. (A) Representative confocal images of laryngeal cancers. The red signals represent the complex between ERp57 and STAT3, and nuclei were counterstained with Hoechst 33342 (blue signal). Scale bar, 20 μm. (B) Four different areas were obtained for each sample and 200 - 500 cells were quantified per area (mm2) using CellProfiler. Data are presented as box-and-whisker plots. (C) Kaplan-Meier survival curves for samples positive (n = 42) for ERp57-STAT3 protein complexes versus those negative (n = 62) for ERp57-STAT3 protein complexes for overall survival. P-values represent univariate Cox regression analyses.