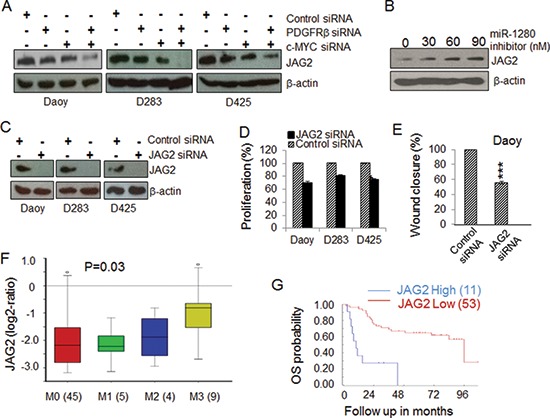
Figure 5. Identification of JAG2 as a potential target of MB.

(A) The expression of JAG2 in MB cells is regulated by PDGFRβ and c-MYC. MB cells were transfected with gene specific siRNAs against PDGFRβ and/or c-MYC for 48 h. Protein lysates extracted from treated samples were used for the expression levels of JAG2 by Western blotting. β-actin was used as a loading control. (B) The expression levels of JAG2 are regulated by a miR-1280 inhibitor. PDGFRβKD Daoy cells were transfected with increasing concentrations of a miR-1280 specific inhibitor. After 48 h, protein lysates extracted were subjected to Western blotting analysis to check for change in expression of JAG2 protein. β-actin was used as a loading control. (C) Confirmation of specific knockdown JAG2 by Western blotting analysis. β-actin was used as the loading control. (D) The effects of JAG2 siRNA on MB cell proliferation. MB cells were transfected with control or JAG2 specific siRNAs for 48 h. Cell proliferation was determined using MTS. (E) The effects of JAG2 on MB cell migration. PDGFRKD Daoy cells were treated with control or JAG2 siRNAs for 36 h and then detached and re-distributed in equal amounts in a 48-well plate before a linear wound was made. The image was captured immediately after an artificial wound was made at 0th h and also at 24th h (Supplemental Figure S4B). Quantified results were calculated from the images. The significance of JAG2 siRNAs on MB cell migration were analyzed using paired t-test, sample vs. control (*p < 0.05, **p < 0.01). (F) The expression of JAG2 in MB tissues of different stages of metastasis (45 patients at M0 stage, 5 patients at M1 stage, 4 patients at M2 stage, and 9 patients at M3 stage); (G) Kaplan-Meier plots of overall survival (OS) time according to JAG2 levels in MB patients.
