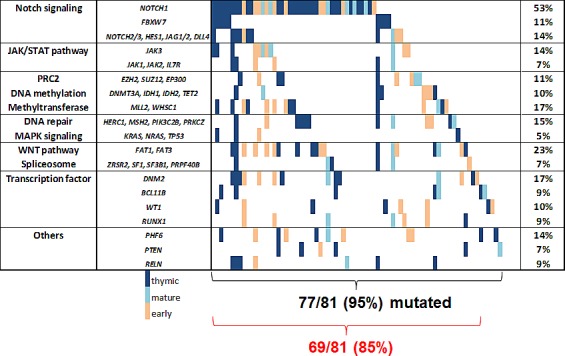
Figure 2. Mutational landscape of adult T-ALL.

In the right column mutations rates are shown for groups with functional similarity. The red brackets summarize pathways representing potential therapeutic targets and their frequency. Genes with a mutation rate below 5% are grouped with functional similar genes or are not shown.
