
Figure 4. Interference with Sema6A expression in BRAF 2/59 cells induces cytoskeletal remodeling and inhibits anchorage-independent growth.
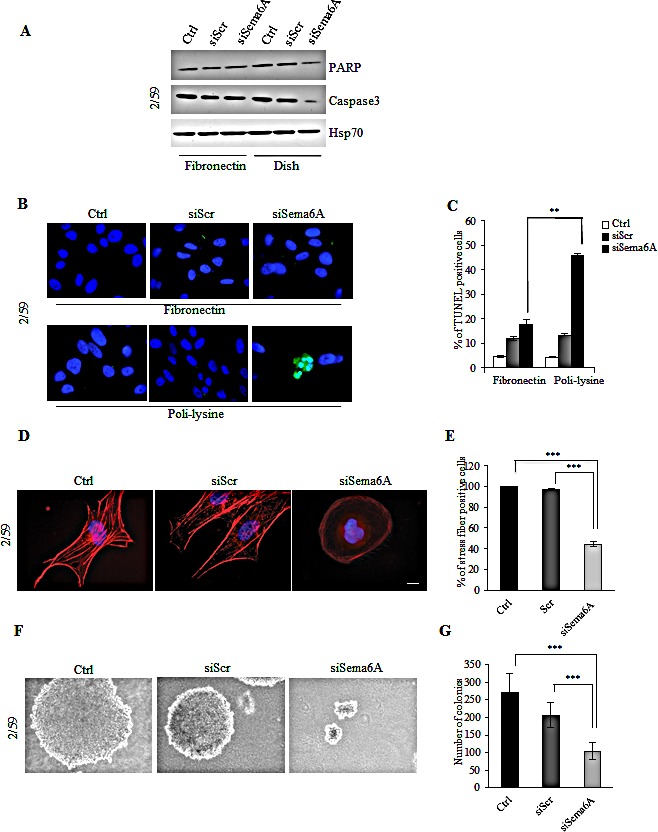
(A) Control, siScr- or siSema6A/BRAFV600E cells were plated onto FN coated-dish or conventional culture-dish. Total cell lysates were analyzed by WB with PARP, Caspase3, and Hsp70 antibodies. (B) Tunel assay of BRAF/siSema6A cells plated on FN and/or poli-lysine. (C) Histogram reported percentage of tunel positive cells (P<0.004). (D) The cells, 48 h post-transfection, were plated on poly-l lysine coated slides, and stained with phalloidin-TRITC to show actin filaments. Scale bar is 10 μm. (E) Histogram reported percentage of stress fiber positive-cells. (F) Ctrl, siScr and siSema6A/BRAFV600E cells soft agar assay. (G) Histogram reported the number of colonies obtained in soft agar assay in Ctrl, siScr and siSema6A cells.