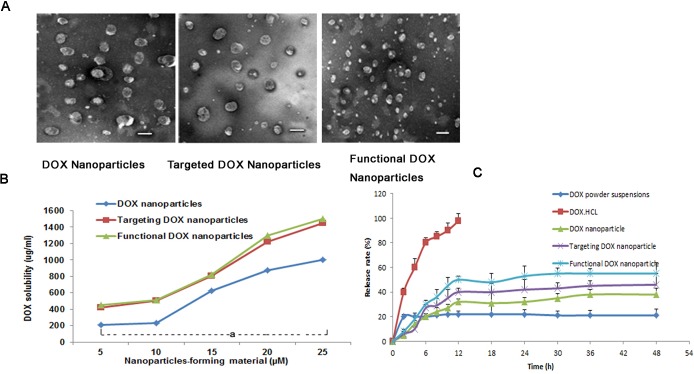
Figure 2. DOX nanoparticles and characterization.
(A) TEM image of different types of nanoparticles, scale bar = 150 nm. (B) Effect of the nanoparticle-forming material's total concentration on the solubilized DOX concentration in the nanoparticles. aP<0.05, compared with DOX nanoparticles. (C) DOX release rates (%) of five different formulations of DOX in PBS containing 10% FBS at 37°C (pH 7.4). The data are presented as the mean ± SD (n=3).

