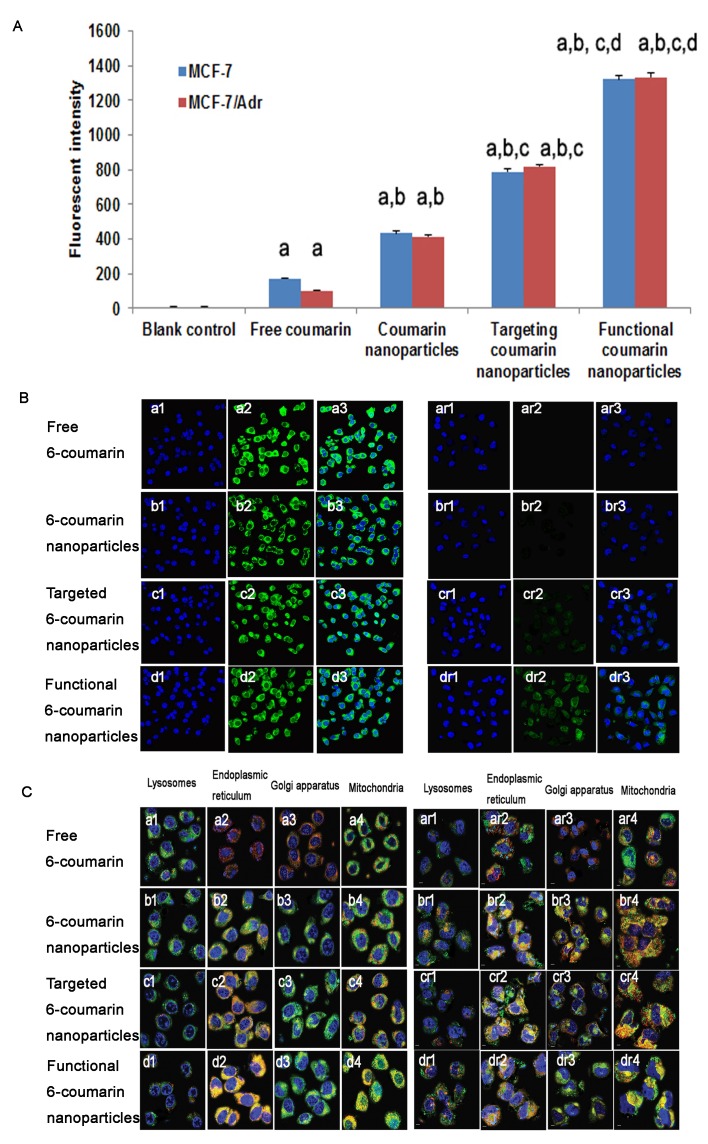
Figure 4. Uptake after incubation with varying formulations.
Uptake of drugs by MCF-7 cells and MCF-7/Adr cells (A). The data are presented as the mean ± SD (n=3). Notes: aP<0.05, compared with blank control; bP<0.05, compared with free 6-coumarin; cP<0.05, compared with 6-coumarin nanoparticles;dP<0.05, compared with targeted 6-coumarin nanoparticles. Uptake of different rhodamine 123-containing formulations by MCF-7 cells (B, left) and MCF-7/Adr cells (B, right). Notes: The blue color denotes the nuclei of MCF-7 or MCF-7/Adr cells stained with Hoechst 33342. The green color denotes rhodamine 123. The overlapping images show both Hoechst 33342 and rhodamine 123 in MCF-7 or MCF-7/Adr cells. (C) Intracellular accumulation in several cytoplasmic organelles in MCF-7 (C, left) and MCF-7/Adr (C, right) cells after treatment with free 6-coumarin, 6-coumarin nanoparticles, targeted 6-coumarin nanoparticles, or functional 6-coumarin nanoparticles. Notes: The blue and green colors denote Hoechst 33342 and 6-coumarin, respectively. The red color denotes lysosomes, the ER, the GA, and mitochondria stained with LysoTracker Red DND-99, ER-Tracker Red, BODIPY TR ceramide complexed to BSA, or MitoTracker Deep Red 633, respectively. The yellow color (merged image) indicates 6-coumarin in different organelles.

