
Figure 3. Catalytic inhibition of endogenous EZH2 Y641N (GOF) alters 3D-morphology of IGR1 melanoma cells.
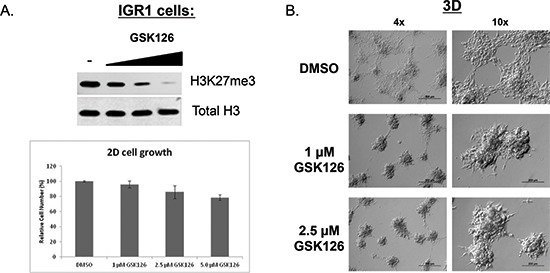
(A) IGR1 cells were treated for 6 days with GSK126 at the indicated concentrations. Cells were counted or used to make lysates for western blot. Top panel: Western blot analysis of H3K27me3 levels following GSK126 treatment. Bottom panel: quantification of cell number (mean −/+ STDEV). (B) IGR1 cells were treated with DMSO, 1 μM or 2.5 μM GSK126 for 7 days in 2D culture and then re-plated (and re-treated) on top of ECM. Images (4x, 10x) were captured 6 days post-seeding.