
Figure 5. Effects of imatinib on mast cell (MC) numbers in C57BL/6J and BALB/c mice.
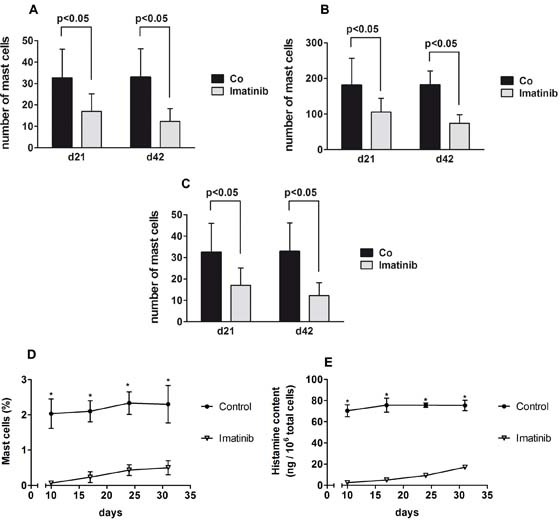
A-C: C57BL/6J mice were treated with imatinib (60 mg/kg per day) or vehicle control (CO) by intraperitoneal (i.p.) injection for 42 days (5 mice per group). Animals were sacrificed on days 21 or 42 and the percentages of MC in the back skin (A), ear skin (B) and gastric mucosa (C) were determined by staining with toluidine blue (TB) as described in the text. In A, B and C, the numbers of MC was determined by TB staining using a Leica DM 4000 B microscope (Solms, Germany) equipped with a HC Plan Apo 20x/0.70 objective lens. Results are expressed as numbers of TB+ cells per HPF using Discus software (Discus, Columbus, Ohio, USA) and represent the mean±S.D. of all mice per group. D-E: Imatinib-induced in vivo depletion of MC in the peritoneum of BALB/c mice. D: Mice were treated with imatinib (25 mg/kg twice daily by i.p. injection) or vehicle alone for 10 days. Peritoneal fluid was recovered in each group of mice (n=3) at various time points (days 10, 17, 24 and 31). The percentage of MC among total peritoneal cells was determined in each animal by TB staining using an Olympus BX51 microscope equipped with a UPlanFI 20x/0.50 objective lens. Results are expressed as mean±S.D. of all mice in each group (imatinib- or vehicle-treated mice). Asterisk: p<0.001. E: Peritoneal fluid samples were adjusted at 106 per mL and subjected to freeze-thawing. Then, cellular histamine levels were determined. Results are expressed as mean concentrations of histamine (ng/106 total peritoneal cells) and represent the mean±S.D. of all mice per group (imatinib- or vehicle-treated animals). Asterisk: p<0.001.