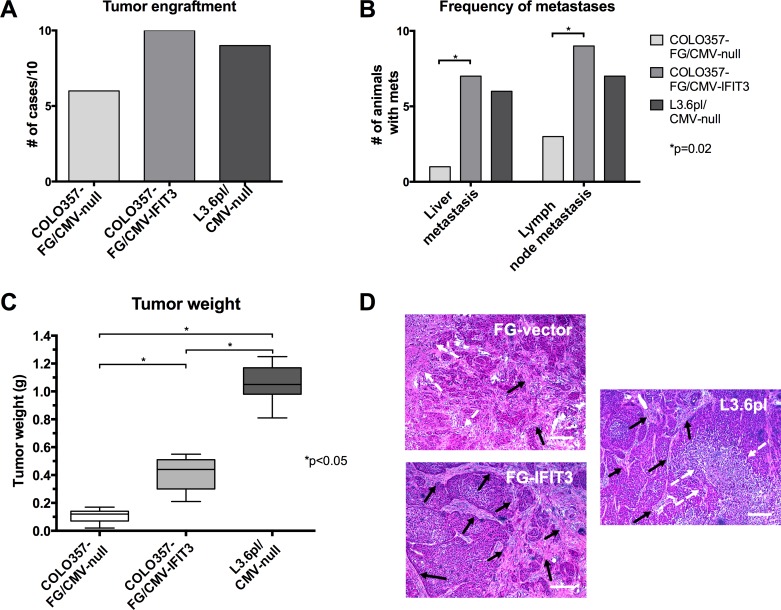
Figure 2. Effects of IFIT3 expression on orthotopic tumor formation and growth.
Orthotopic injection of tumor cell lines was performed into the pancreas of nu/nu mice (n=10 for each group). (A) The graph depicts the number of successful tumor engraftments leading to visible tumors in the pancreas after sacrifice of the animal. (B) Graph shows the number of respective animals that developed liver or lymph node metastasis, which were defined to be visible by eye and exceed 1 mm in diameter. Fisher's exact tests were used to determine statistical significance. (C) Box plots with the line representing median, whiskers representing range and boxes representing interquartile range of tumor mass for each group. Statistical significance between groups was tested using Mann-Whitney-U tests. (D) Representative H&E stains of paraffin-embedded tumor slides. A more profound desmoplastic reaction was observed in IFIT3 overexpressing tumors (black arrows: stromal tissue, white arrow: necrosis, bars: 200 μm).

