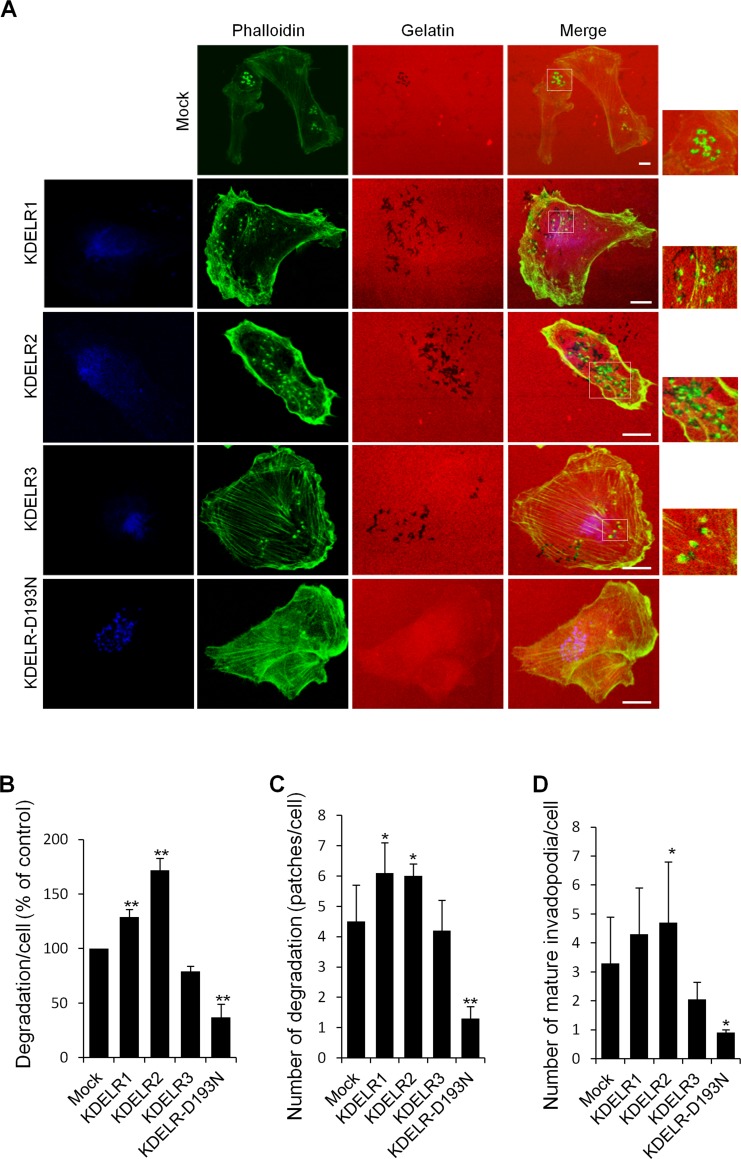
Figure 5. KDELR modulates the degradation of the ECM and the formation of invadopodia in MDA-MB-231 cells.
(A) MDA-MB-231 cells were transfected with empty vector (Mock) or the myc-tagged KDELR isoforms, for KDELR1, KDELR2, KDELR3, or KDELR-D193N-myc (as indicated) and grown on rhodamine-conjugated (red) crosslinked gelatine for 16 h in the presence of BB94. Following BB94 wash-out, the cells were incubated for 90 min and then fixed and stained with phalloidin (green) and an anti-myc antibody (blue, KDELR2-myc and KDELR-D193N-myc). Merged images of red and green (Mock) and red, green and blue signals (KDELRs and KDELR-D193N) are also shown (Merge) Invadopodia are shown in the enlargements of the boxed regions (small right panels: green and red signals). Scale bars, 10 μm. The images are representative of three independent experiments. (B) Quantification of the degradation area per cell (% of control). (C) Quantification of the number of degradation patches per cell (D) Quantification of the number of mature invadopodia per cell. Data are expressed, as means ±SEM of three independent experiments, with at least 50 cells quantified per experiment. **p <0.01, **p <0.05 compared to Mock cells (t-test).

