
Figure 3. Synergistic effects of Chk1 and Wee1 inhibitors in MCL cell lines.
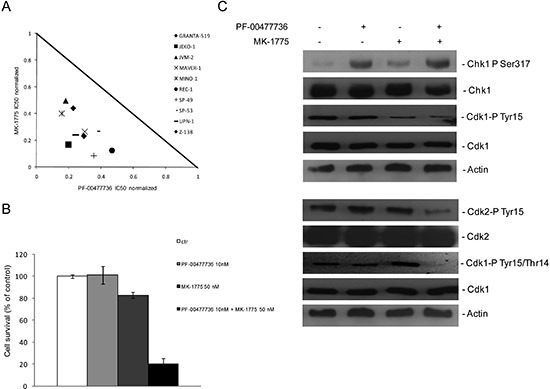
(A) Normalized IC50 isobologram showing the synergistic effects of the combination in 10 MCL cell lines (see legend). (B) JeKo-1 cell survival after 72 hrs of treatment with PF-00477736 10 nM, MK-1775 50 nM or both drugs. Data are percentages of untreated cells and represent the mean ±SD of three independent experiments. (C) (upper panel) Western blot analysis showing pS317-Chk1, Chk1, pY15-CDK1, CDK1 and actin protein levels in JeKo-1 cells, 24 hrs after treatment with the single drugs or the combination. (lower panel) Western blot analysis showing pY15-CDK2, CDK2, pY15/T14-CDK1, CDK1 and actin protein levels in JeKo-1 cells, 48 hrs after treatment with the single drugs or the combination.