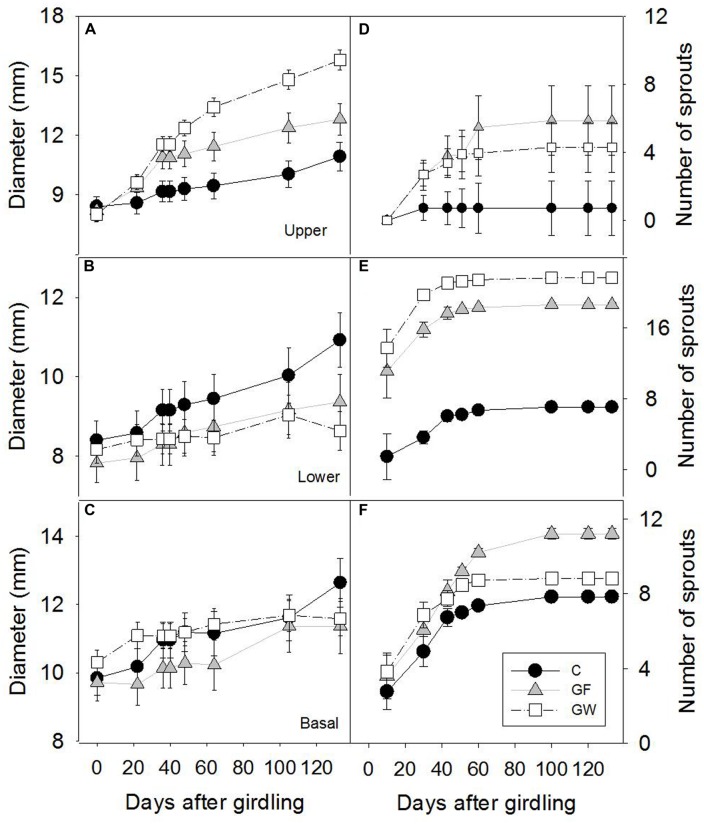
FIGURE 3.
Time frame of stem diameter growth (A) above the girdle (U), (B) below the girdle (L) and (C) in the base of the stem (B) and accumulated number of sprouts (D) above the girdle, (E) below the girdle and (F) in the base of the stem in control (C), in fine girdled (GF) and wide girdled (GW) plants. Error bars represent the standard error.

