Figure 10.

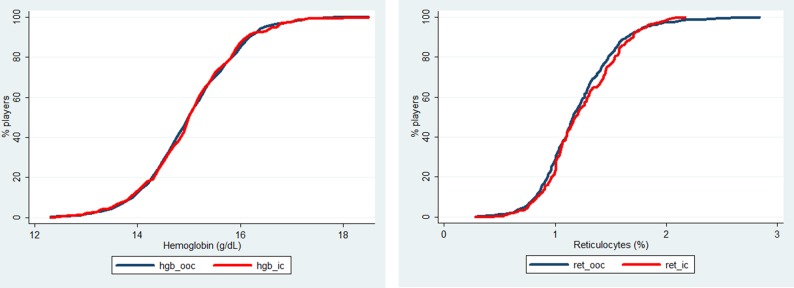
Cumulative frequency distribution curves for haemoglobin (left panel) and reticulocytes (right panel) in the in competition (red line) and out-of-competition (black line) samples.

Cumulative frequency distribution curves for haemoglobin (left panel) and reticulocytes (right panel) in the in competition (red line) and out-of-competition (black line) samples.