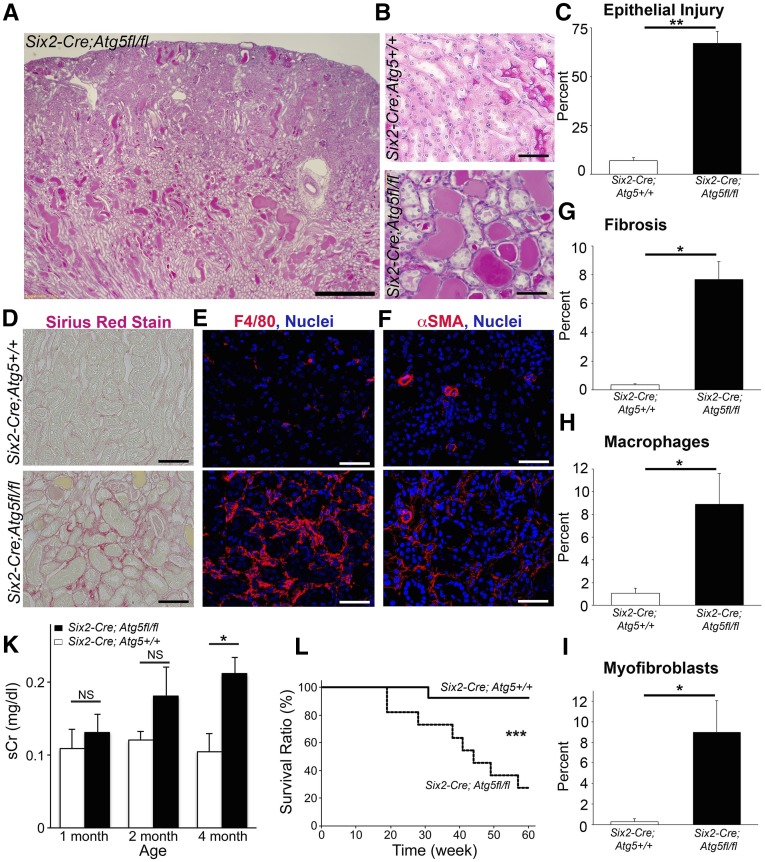
Figure 2.
Mutation of ATG5 in kidney epithelium causes tubulointerstitial disease. (A and B) Lower- and higher-power images showing the extent of tubulointerstitial disease in ATG5 mutant mice at 4 months. (C) Tubular injury score at 4 months. (D–F) Images showing interstitial fibrosis stained by sirius red, macrophage infiltration, and myofibroblast accumulation in the interstitium. (G–I) Quantification of fibrosis, macrophages, and myofibroblasts. (J) Time course of plasma creatinine levels in wild-type and mutant mice. (K) Kaplan–Meier survival curve (P<0.001 by Wilcoxon test). Data are mean±SEM. n=4–13/group. *P<0.05; **P<0.01; ***P<0.001. Bar=500 µm (A) and 100 µm (B–F).

