
Figure 5.
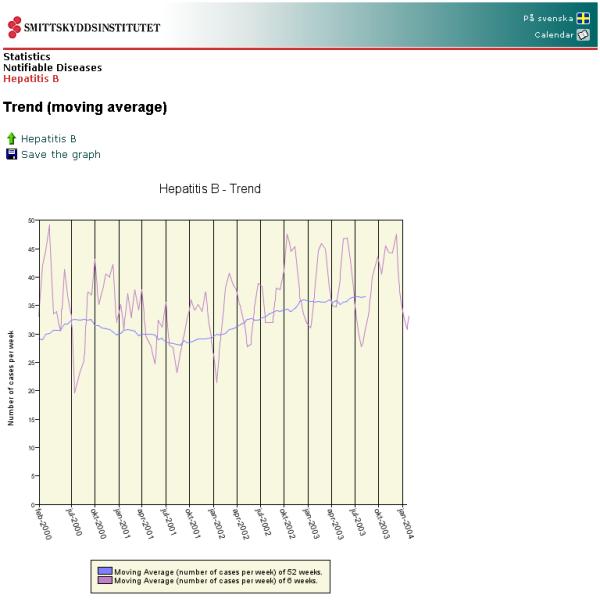
Screenshot of the graph illustrating trends. The red curve represents seasonal trends and the blue represents yearly trends.
Official websites use .gov
A
.gov website belongs to an official
government organization in the United States.
Secure .gov websites use HTTPS
A lock (
) or https:// means you've safely
connected to the .gov website. Share sensitive
information only on official, secure websites.
Screenshot of the graph illustrating trends. The red curve represents seasonal trends and the blue represents yearly trends.