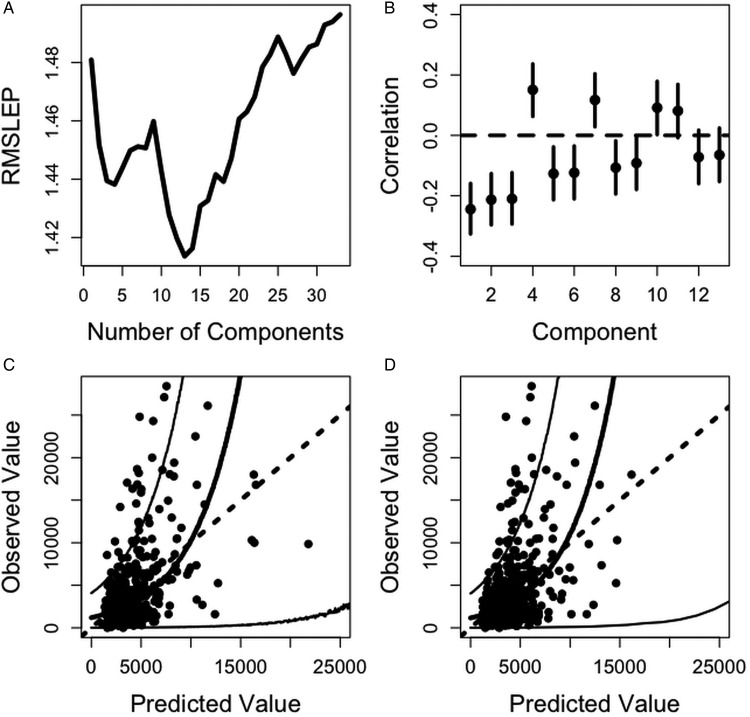
Fig. 3.
(A) RMSLEP for worm number prediction using a range of component numbers in CPC regression. This value is minimized using 13 components. (B) Correlations between the first 18 components and worm number (dots) and 95% confidence intervals (solid lines). (C) Predicted worm number values using 18 components in CPC regression (CPCR3_Number) plotted against observed worm number with fitted line and prediction intervals (solid lines) and the line of equality (dotted line). (D) Predicted worm number using the minimal set of traits (MR1_Number) plotted against observed worm number with fitted line and prediction intervals (solid lines) and the line of equality (dotted line).

