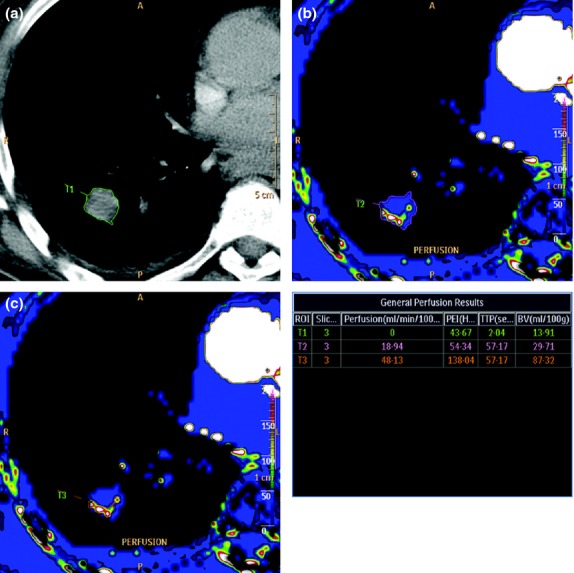
Figure 2.

Examples of three different DCE-CT tumour ROIs using the quantitative method in a 69-year-old male with an adenocarcinoma in the right lung: (a) T1, a large ROI comprising the entire tumour. The ROI is drawn on a morphological image; (b) T2, a large ROI comprising the same entire tumour. This time, the ROI is drawn on a perfusion map; and (c) T3, a small ROI comprising only the maximally perfused parts of the tumour. The ROI is drawn on a perfusion map. These examples illustrate the significance of choosing the right ROI method and the importance of stating the chosen method in the report.
