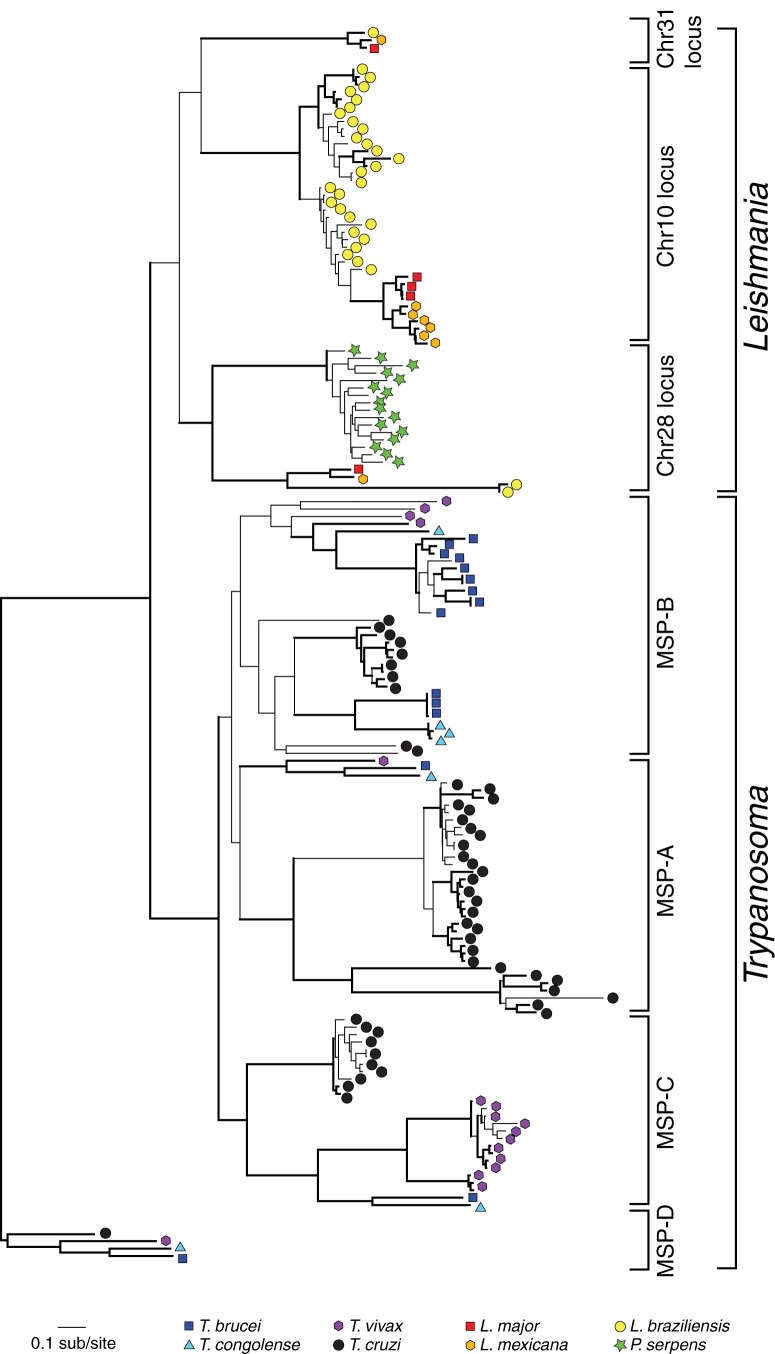
Fig. 3.
Major Surface Protease (MSP) gene family phylogeny. This maximum likelihood phylogeny of MSP amino acid sequences sampled from completed genome sequences was estimated using PHYML and a LG+Γ model of amino acid substitution (Guindon et al. 2010). Node robustness was assessed with non-parametric bootstraps; branches with bootstrap support >75 are shown with bold lines. Sequences are labelled with coloured symbols, according to the key. The tree is mid-point rooted, which corresponds with the Trypanosoma-specific MSP-D locus (Marcoux et al. 2010).

