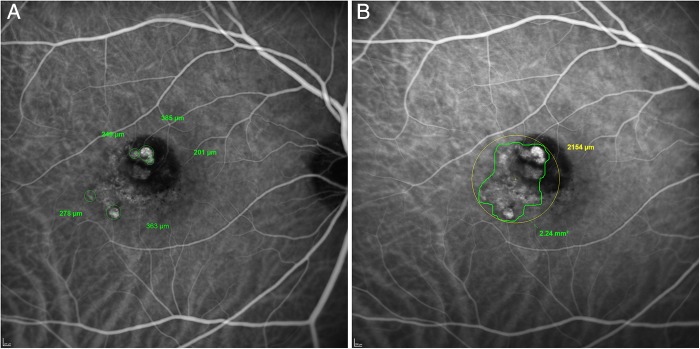
Figure 3.

Grading diagrams from the Central Reading Center. (A) Grading diagram illustrating the location of each polyp, with the diameter of each polyp shown by the figures in green. (B) Grading diagram illustrating the outline of the entire polypoidal choroidal vasculopathy (PCV) lesion (green), with a best-fit circle (yellow) used to calculate the greatest linear dimension (GLD). The area of the PCV lesion and the GLD are shown.
