. 2015 Mar 27;4:e06119. doi: 10.7554/eLife.06119

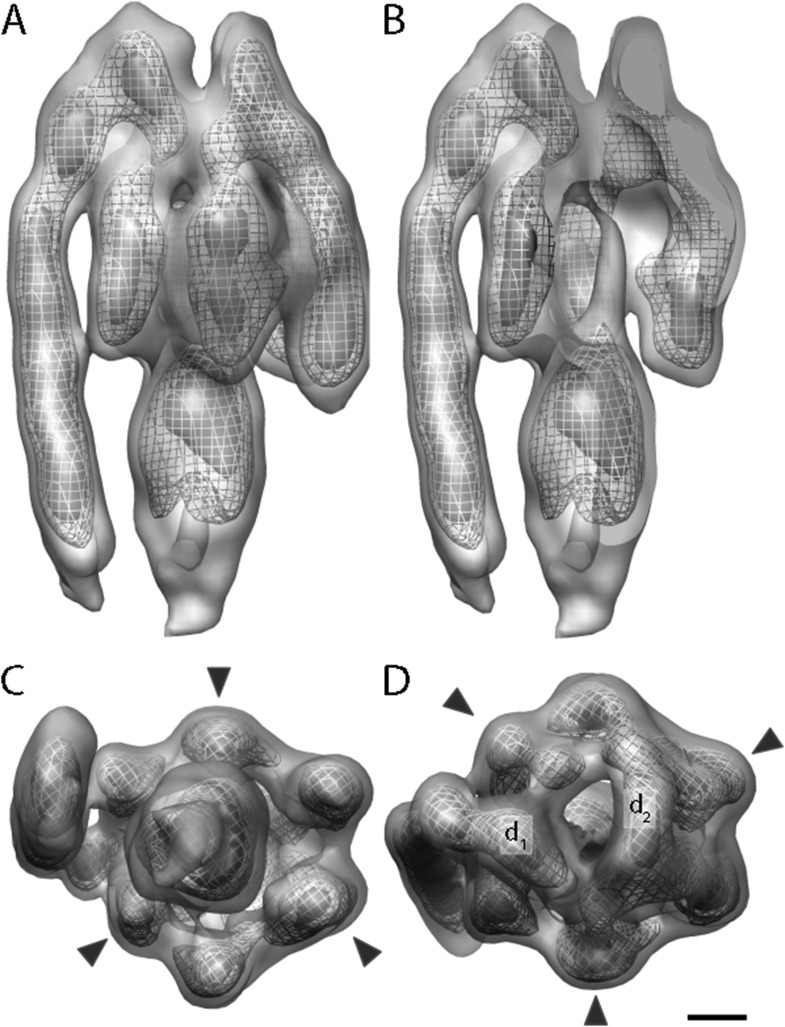
Figure 3. Sub-tomogram average of bovine heart mitochondrial F1Fo ATP synthase calculated from 2D crystals.

(A) Surface view, (B) longitudinal section showing central stalk, (C) bottom view and (D) top view. Arrowheads: positions of the β subunits. d1 and d2: densities connecting peripheral stalk to F1 subcomplex. Threshold levels: light grey, 1 σ; mesh, 3 σ; dark grey, 5 σ. Scale bar: 20 Å.

DOI: http://dx.doi.org/10.7554/eLife.06119.008

Figure 3.

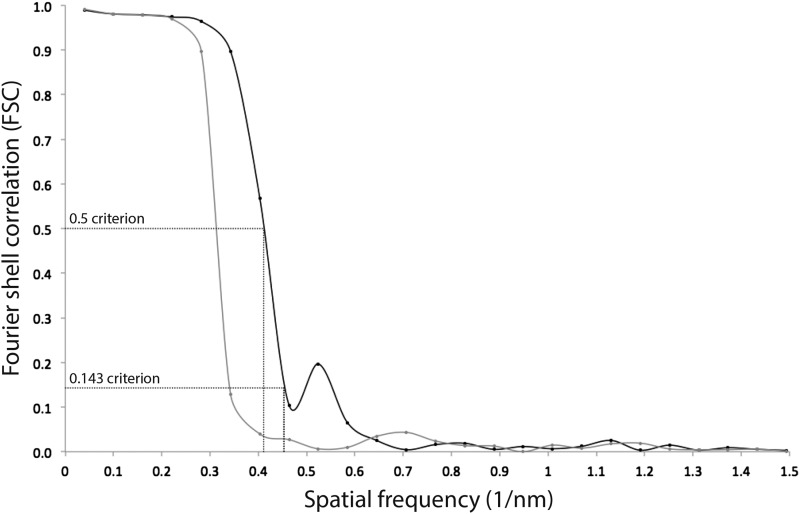
Figure 3—figure supplement 1. Resolution estimate of the ATP synthase monomer sub-tomogram average.

Figure 3—figure supplement 1.

Fourier shell correlation (FSC) curves were calculated by comparing averages generated from two independently processed data sets (‘Gold standard’; Scheres and Chen, 2012, black line). To check for overfitting, phases beyond 40 Å were randomized (Chen et al., 2013) and the final alignment iteration repeated (grey line). According to the FSC 0.5 criterion (crosshairs), the ATP synthase monomer average has a resolution of 2.4 nm. Points on the FSC curves mark spatial frequency shells used in the FSC calculation.
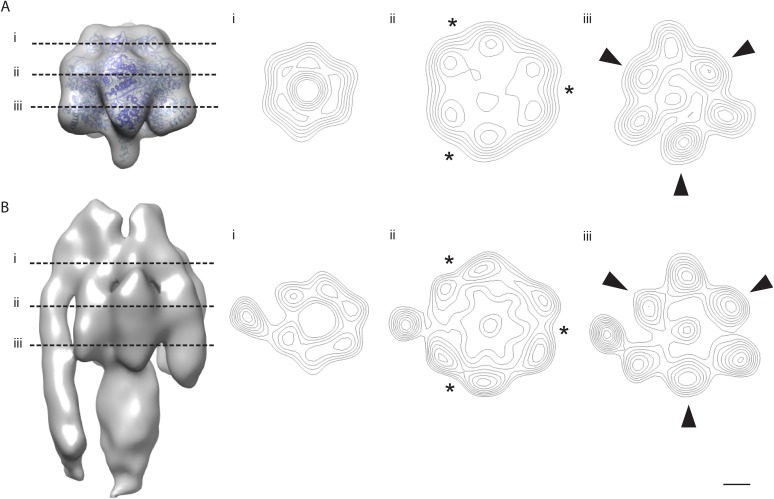
Figure 3—figure supplement 2. The α/β hexamer.

Figure 3—figure supplement 2.

(A) X-ray map of catalytic domain (PDB code: 1BMF, Abrahams et al., 1994) Fourier-filtered to 25 Å. (B) Subtomogram average calculated from 2D crystals. Dashed lines, cross-section levels in i–iii. Arrowheads, beta subunits *, catalytic interface between α and β subunits. Contour levels drawn at intervals of 0.5 sigma above mean. Scale bar, 20 Å.