. 2015 Mar 27;4:e06119. doi: 10.7554/eLife.06119

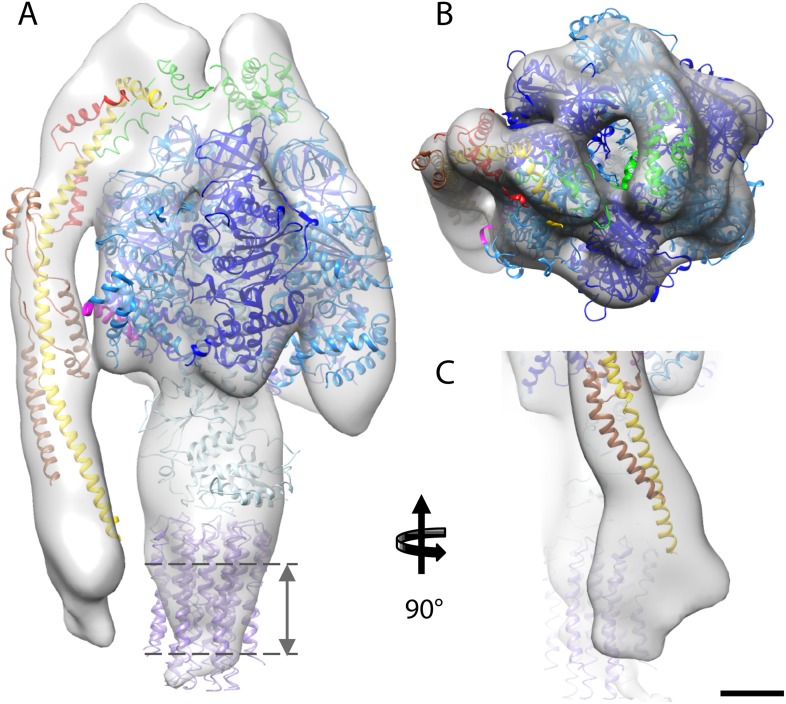
Figure 4. Fitted atomic model of the bovine F1Fo ATP synthase.

(AC) Sub-tomogram average with fitted atomic models (A) side view, (B) top view, and (C) the peripheral stalk. Blue, catalytic domain; grey, central stalk; green, oligomycin sensitivity conferral protein (OSCP) from PDB:2WSS (Rees et al., 2009). Purple, c-ring (PDB:2XND) (Watt et al., 2010); Yellow-red, peripheral stalk fragment (PDB: 2CLY) (Dickson et al., 2006) with additional residues from PDB:2WSS (Rees et al., 2009). Pink, α-subunit helix thought to interact with the peripheral stalk. Dashed lines, position of membrane. Scale bar, 20 Å.

DOI: http://dx.doi.org/10.7554/eLife.06119.011

Figure 4.

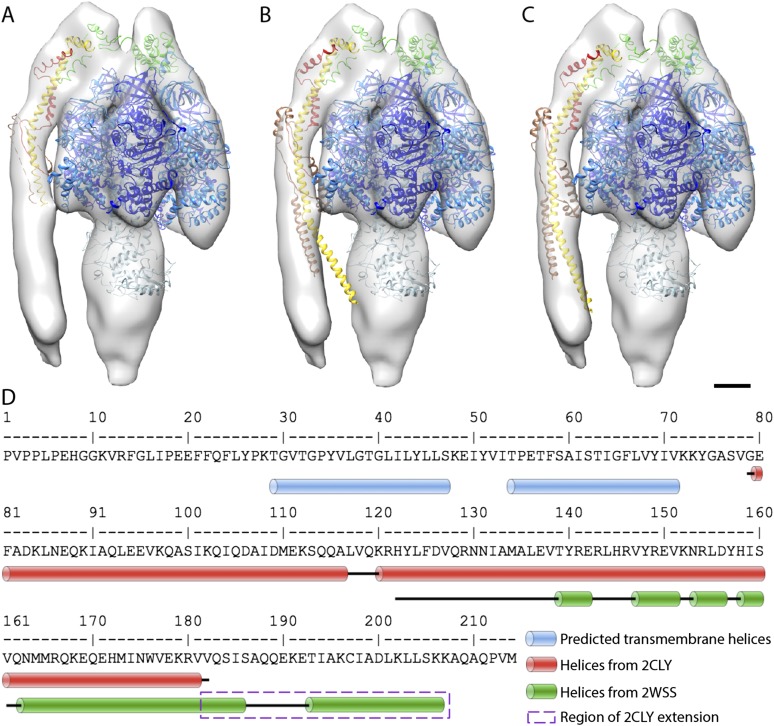
Figure 4—figure supplement 1. Possible atomic models fitted to sub-tomogram average.

Figure 4—figure supplement 1.

(A) Sub-tomogram average fitted with the F1/peripheral stalk complex (PDB entry: 2WSS). (B) as in (A) but peripheral stalk extended with the atomic model of the peripheral stalk fragment (PDB:2CLY). (C) as in (B) but the extended peripheral stalk sub-complex plus C-terminal domain of the OSCP subunit fitted to the average as a rigid-body subsequent to the fitting of the F1-subcomplex plus N-terminal domain of the OSCP subunit from 2WSS. (D) Sequence of the peripheral stalk subunit b from bovine heart showing the position of the predicted trans-membrane helices (blue) and the known helices (red and green) determined by x-ray crystallography. The dashed purple box indicates the residues from PDB:2WSS by which the PDB:2CLY structure was extended for rigid-body fitting in (C). Atomic model subunit colors: blue, α; dark blue, β; light blue, γ,δ,ε; yellow, b; red, F6; brown, d; green OSCP. Scale bar: 20 Å.