Figure 2.

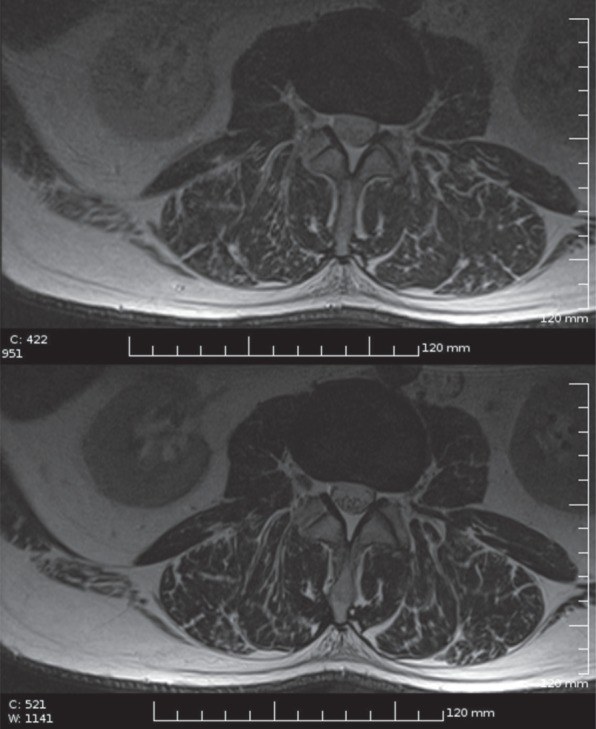
Lumbar spine imaging with ICD: low SAR T2 FSE sequence (upper image) compared with normal T2 FSE in the same subject (lower image, for the scanning parameters see the Discussion section).

Lumbar spine imaging with ICD: low SAR T2 FSE sequence (upper image) compared with normal T2 FSE in the same subject (lower image, for the scanning parameters see the Discussion section).