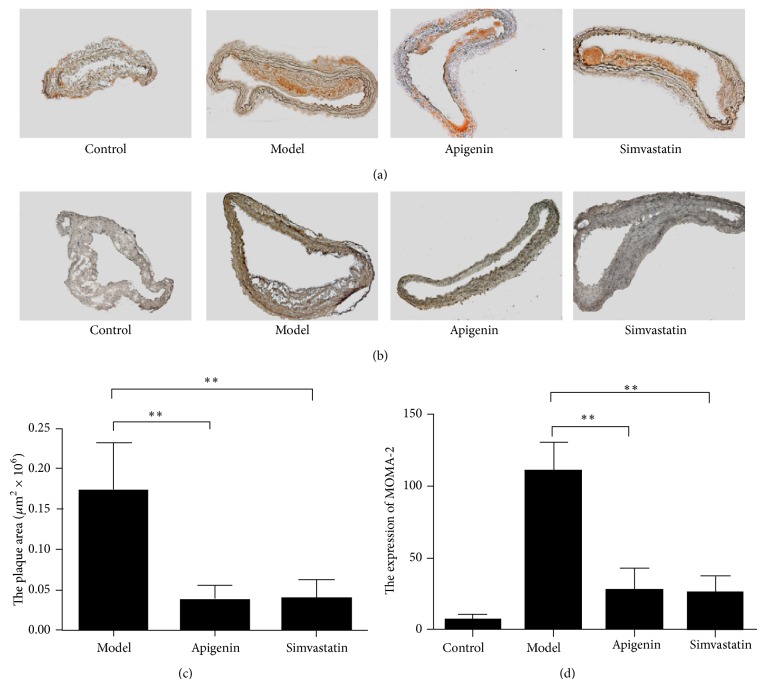
Figure 1.
Antiatherogenesis activity of apigenin in apoE −/− mice. (a) Representative images of the aortas stained with Sudan III. (b) Representative images of MOMA-2 stained sections from the proximal aortas. (c) Quantitative analyses of the plaque areas in (a). (d) Quantification of MOMA-2 expression level in (b). ∗∗ P < 0.01 compared with the model group.

