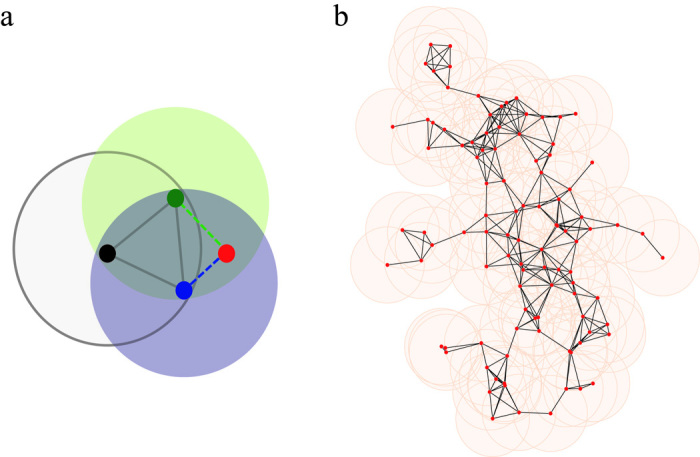
Figure 1. An illustration of the basic model in d = 2-dimensional space.

(a) The filled disks represent existing nodes, the red disk represents a newly added node that will survive. The dark lines represent existing links, and the dashed lines represent the newly added links. The shaded areas represent the interaction regions of existing nodes. (b) A simulation of the basic model after
 steps and
 nodes. The shaded area represents
 in two-dimensional space. In all simulations
 .
.
