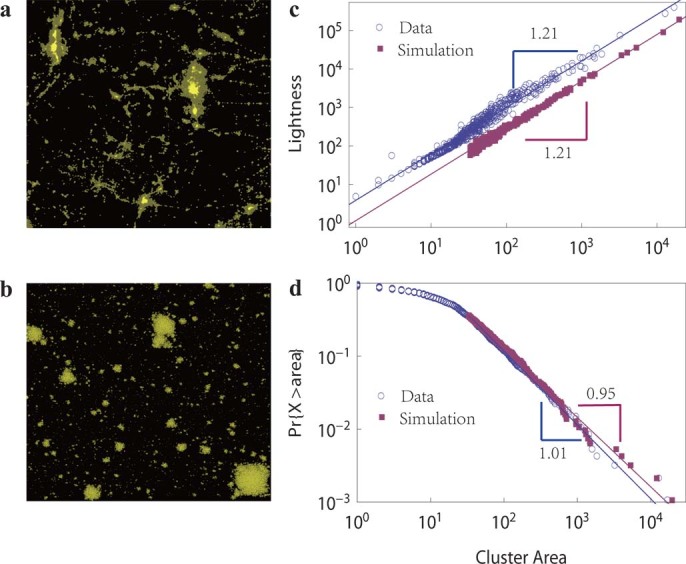
Figure 3. Comparison of modified SCA model with nighttime light data.

(a) Satellite image of a nighttime light distribution. We suppose that each connected cluster in the image is a natural city. (b) The clusters grown by the model using the modified rules
 . (c) The scaling between the total area and the total light intensity of these clusters both for the nighttime light image (blue circles) and for the image generated by the model (purple squares). In the model, we take the total number of edges of each cluster to represent its total light intensity. (d) Area distributions of nighttime light clusters (blue circles) and the model's clusters (purple squares). In (c) and (d), only clusters with sizes larger than 33 in simulation are shown for comparison. In all simulations,
 .
.
