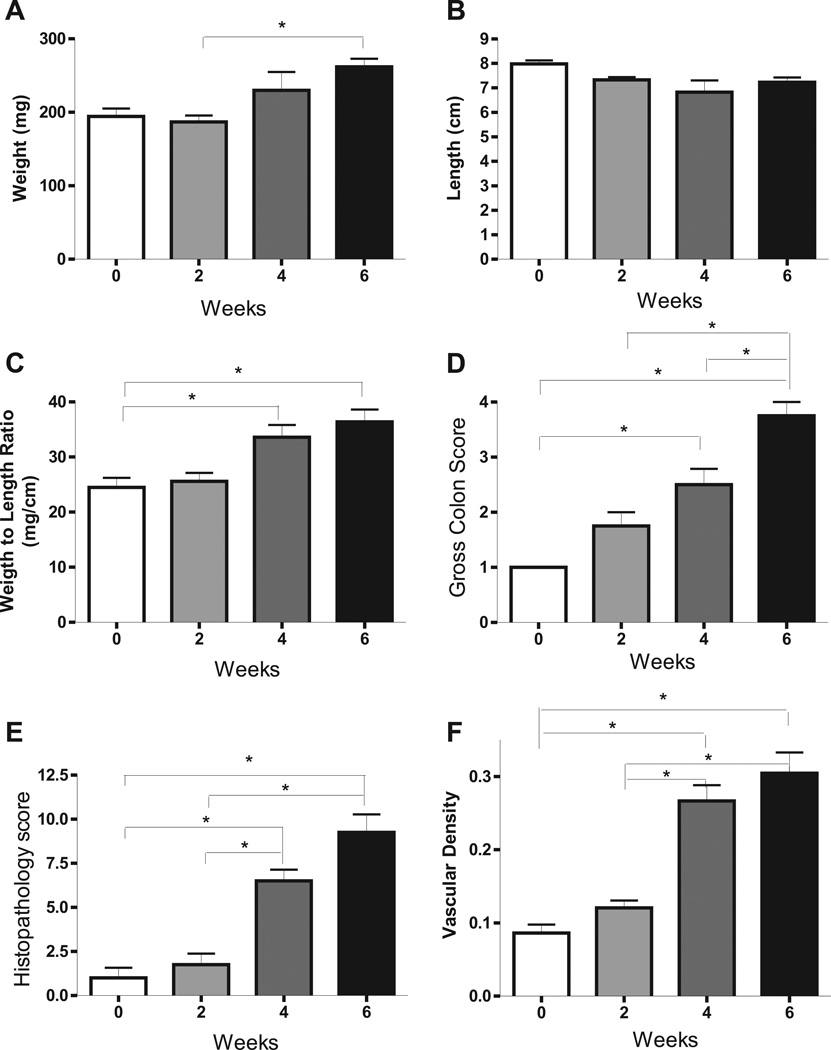
Figure 2. T cell transfer colitis model progressively increases multiple disease parameters over time.
The tissue histopathology score, colon length, colon weight, and vascular density were measured at weeks 0, 2, 4 and 6. A: colon weight at weeks 0, 2, 4 and 6. B: colon length at weeks 0, 2, 4 and 6. C–F: colon weight to length ration, gross colon score, tissue pathology and vascular density at discrete time points. *P<0.05 vs. week 0 (n=4) by 1-way ANOVA with Bonferroni posttest; n=4 animals per time cohort at weeks 2, 4 and 6.

