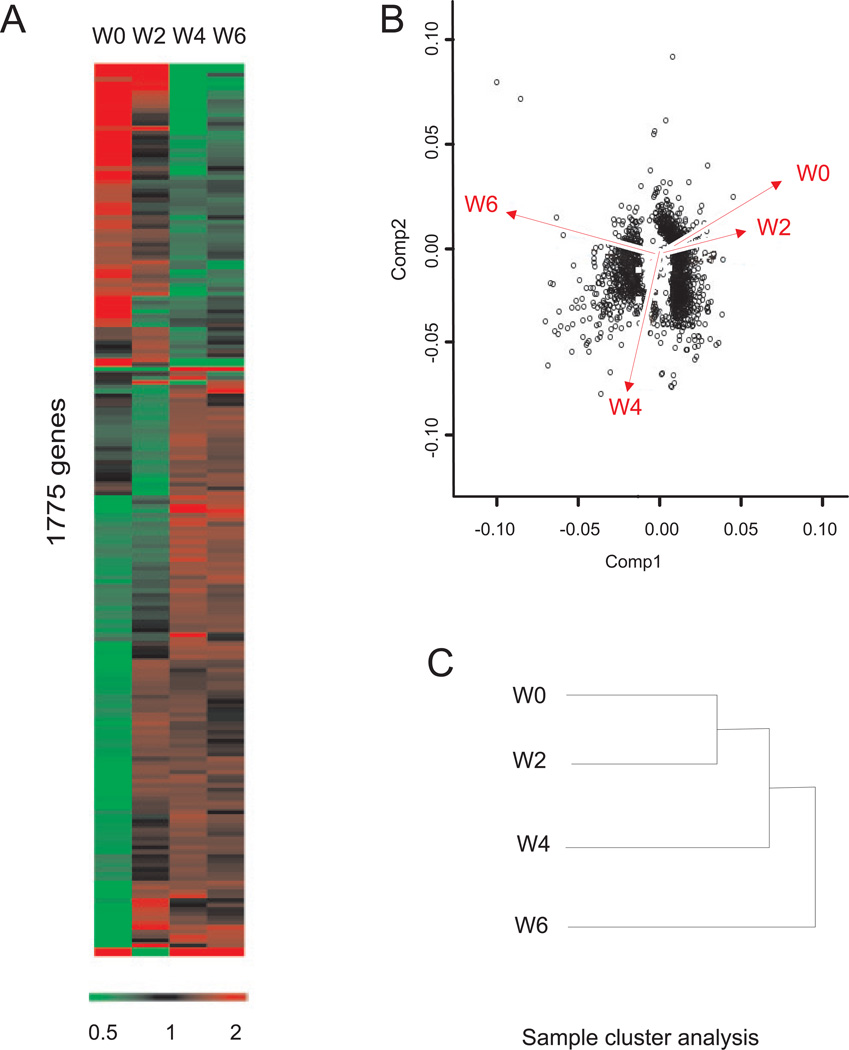
Figure 3. Genesifter analysis of T cell mediated colitis array data.
A: Genesifter program heat map analysis, 1,775 genes were identified from the 39,000 transcripts that significantly changed over the experimental time course at weeks 0, 2, 4 and 6. B: Principal component analysis (PCA) of the gene expression pattern using eigenvalues of covariance. Component 1 (Comp 1) represents the actual change in the gene expression profile, while component 2 (Comp2) illustrates the trend of change in gene expression. X- and y- Axis values are arbitrary units for eigenvalues and gene expression represented by dots. C: sample cluster analysis show that gene expression profiles can be divided into three groups, week 0 and week 2 in one group, which diverge from week 4 (second group) and week 6 (third group).

