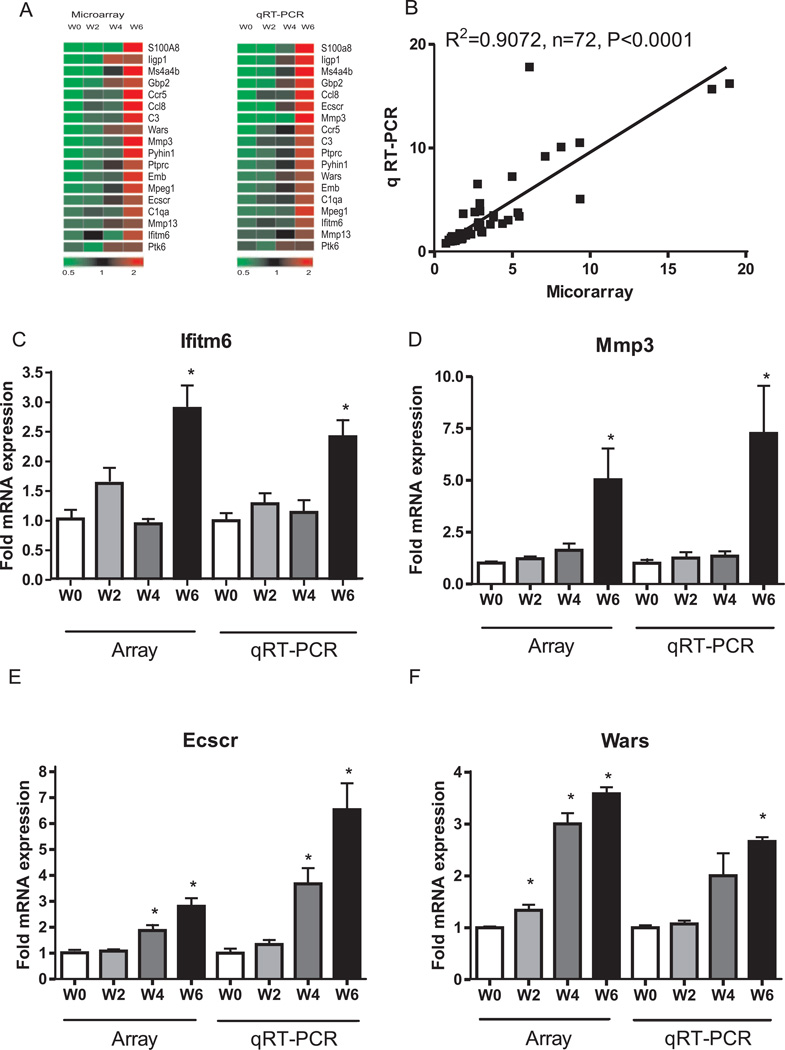
Figure 5. Quantitative real-time PCR (qRT-PCR) validation of T cell transfer colitis microarray data.
qRT-PCR validation was performed for numerous genes identified by microarray analysis. A: microarray vs. qRT-PCR expression heat map for 18 individual genes. B: correlation in gene expression between microarray (x-axis) and qRT-PCR (y-axis) changes in gene expression with r2=0.9072, P<0.0001 at the 95% confidential level, n=72. C, D, E, F: representative validation between microarray and qRT-PCR gene expression for Ifitm6, Mmp3, Ecscr and Wars respectively. *P<0.01 vs week 0 (n=4), at weeks 2, 4 and 6 (n=4).

