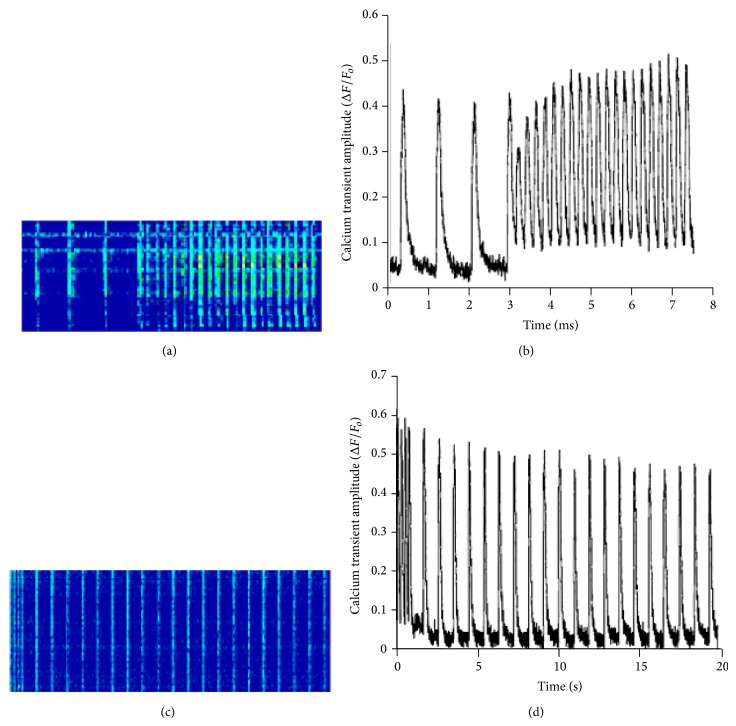
Figure 5.
Line-scans of a Rhod-2 AM loaded isolated trabecula and changes in calcium amplitude during changes in pacing frequency from 1 Hz to 4 Hz and 4 Hz to 1 Hz. (a) Representative image of matrix line-scan of Rhod-2 AM loaded, isolated muscle, during frequency change from 1 Hz to 4 Hz and corresponding change (b) in calcium transient amplitude (ΔF/F o). Representative image of line-scan of Rhod-2 AM loaded isolated muscle (c) during frequency change from 4 Hz to 1 Hz and corresponding calcium transient amplitude trace (d) (ΔF/F o).

