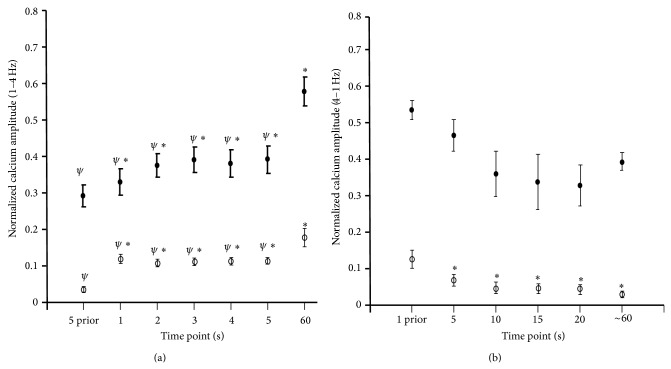
Figure 6.
Normalized calcium transient amplitude during changes in pacing frequency. (a) Average relative calcium amplitude (n = 6) during the transition from 1 Hz to 4 Hz. Maximal and minimal calcium transient amplitudes were averaged for 5 seconds prior to the 4 Hz change in frequency, at the 1-, 2-, 3-, 4-, 5-, and 60-second time points following the frequency switch to 4 Hz. ∗ represents statistical significance from 5-second prior value and ψ represent statistical significance from 60-second value, P < 0.05. (b) Average relative maximal and minimal calcium transient amplitude recorded at 1 second prior to the 1 Hz frequency change and at 5, 10, 15, 20, and 60 seconds during the 1 Hz stabilization process (n = 4). ∗ represents a statistical significance from 1 second prior values. A P < 0.05 is considered significant.

