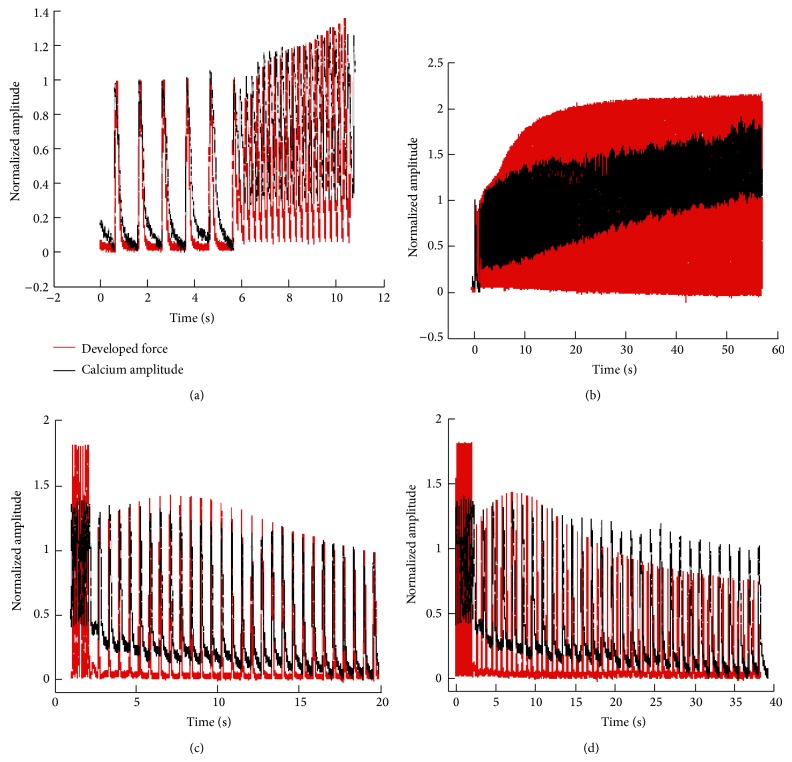
Figure 7.
Force and calcium response during twitch after increases in pacing frequency. (a) Overlay of force and calcium tracings normalized to 1 Hz values during the transition from 1 Hz to 4 Hz (approximately 11 seconds). Twitch profiles and calcium transient changes are recorded for every contraction occurring in the trabecula during the brief transition from 1 Hz to 4 Hz. (b) Overlay of force and calcium tracings normalized to 1 Hz values. One twitch at 1 Hz is recorded followed by every twitch that occurs during the 4 Hz stabilization process (60 seconds total). (c) Normalized force tracings overlaid with normalized relative calcium amplitude transients of an individual isolated muscle during a frequency change from 4 Hz to 1 Hz (approximately 20 seconds). Tracings are normalized to 1 Hz stabilized values. (d) Overlay of force and calcium tracings normalized to 1 Hz values. Eight twitches at 4 Hz are recorded followed by every twitch that occurs during the 1 Hz stabilization process (40 seconds total).

