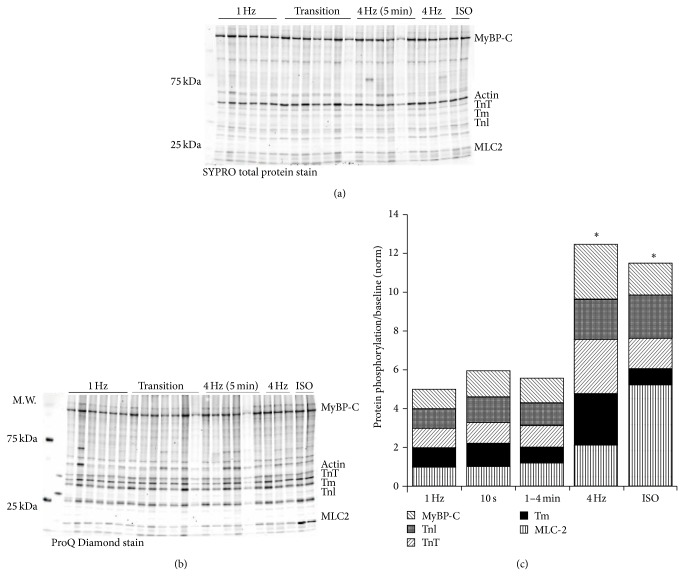
Figure 9.
Alterations in phosphorylation during early and late frequency stabilization. Isolated trabeculae were frozen after stabilization at 1 Hz, up to 10 seconds following the switch from 1 Hz to 4 Hz, and 1 and 4 minutes after the switch from 1 to 4 Hz. Two trabeculae were also treated with ISO as a positive control for phosphorylation. (a) SYPRO Ruby total protein analysis of pertinent myofilament proteins. (b) ProQ Diamond analysis of key myofilament protein phosphorylation state. (c) Normalized (to 1 Hz) ratio of phosphorylated TnI and MyBP-C to total actin, and phosphorylated TnT, MLC-2, and Tm to total protein indicated a significant increase in cumulative phosphorylation at 4 Hz compared to 1 Hz but no significant changes during the early (10 seconds) and mid- (1–4 minutes) transition. ∗ represents a statistical significance from 1 Hz levels, P < 0.05.

