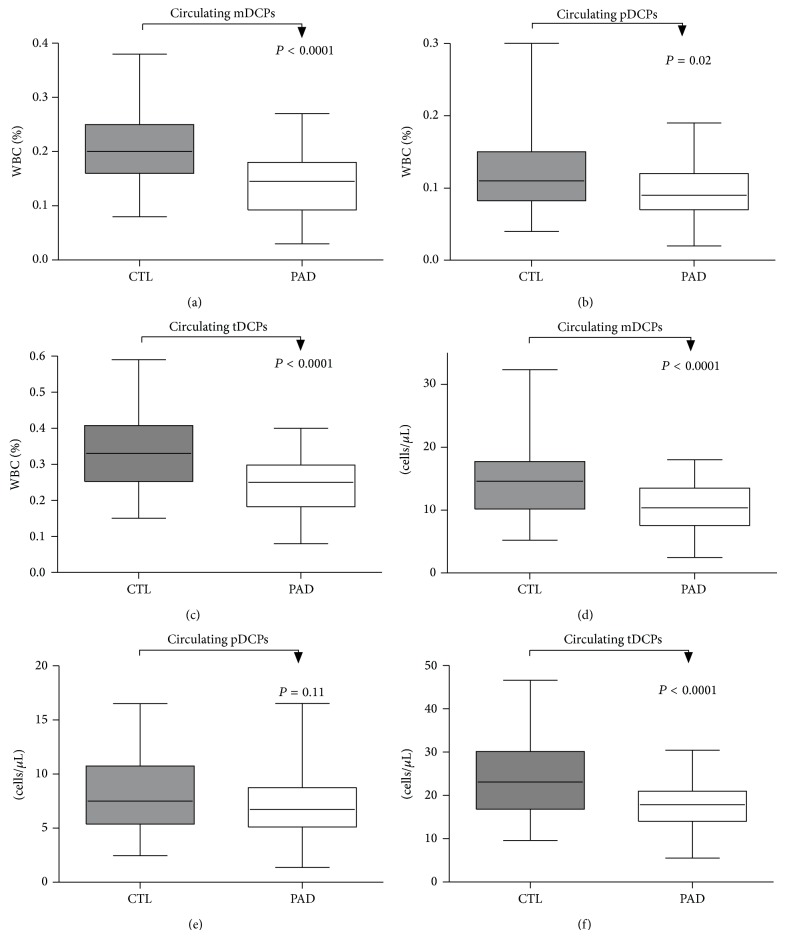
Figure 2.
Frequency of circulating mDCPs, pDCPs, and tDCPs in patients with PAD compared with healthy controls. Relative numbers of circulating mDCPs (a), pDCPs (b), and tDCPs (c) shown as percentage of white blood cell count (% of WBCs) and absolute numbers of circulating mDCPs (d), pDCPs (e), and tDCPs (f) (cells/μL) are shown. The box plots indicate the median (line inside the box), 25th and 75th percentile (lower and upper boundary of the box), and 10th and 90th percentile (whiskers outside box).

