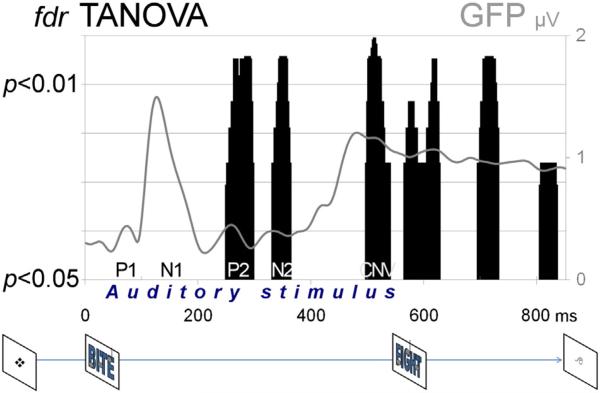
Fig. 1.
Top: The GFP curve (solid gray line; averaged across both tasks) illustrates the time-course of the unfolding robust auditory ERP response with the typical P1, N1, P2, and N2 components. The black vertical bars indicate time-points with whole-map topographic differences between the rhyme and tone judgment tasks (fdr-corrected TANOVA p < 0.05) indexing the modulation of the auditory ERP response by selective attention to phonology. Bottom: Trial sequence. Within a rhyme or tone judgment task block, a trial began with a reminder task cue. Then a chimeric word/tone stimulus was played, followed by a second chimeric word/tone stimulus, after which participants indicated whether the words within the pair rhymed or the tone melodies matched.

