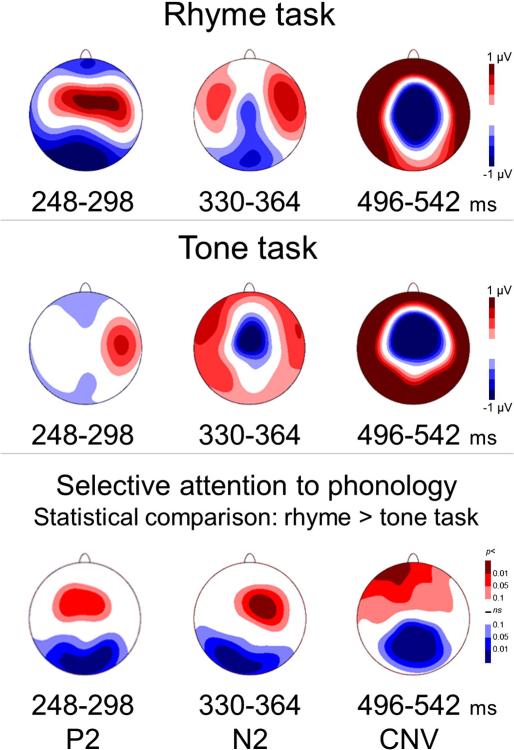
Fig. 2.
Selective attention to phonology modulates P2, N2, and CNV components. Top two panels show voltage maps (all 129 electrodes in a planar projection) of TANOVA-defined time-windows where significant (fdr p < 0.05) rhyme greater than tone task differences emerged. Bottom panel shows the topography of the effect of selective attention to phonology in these averaged time-windows.

