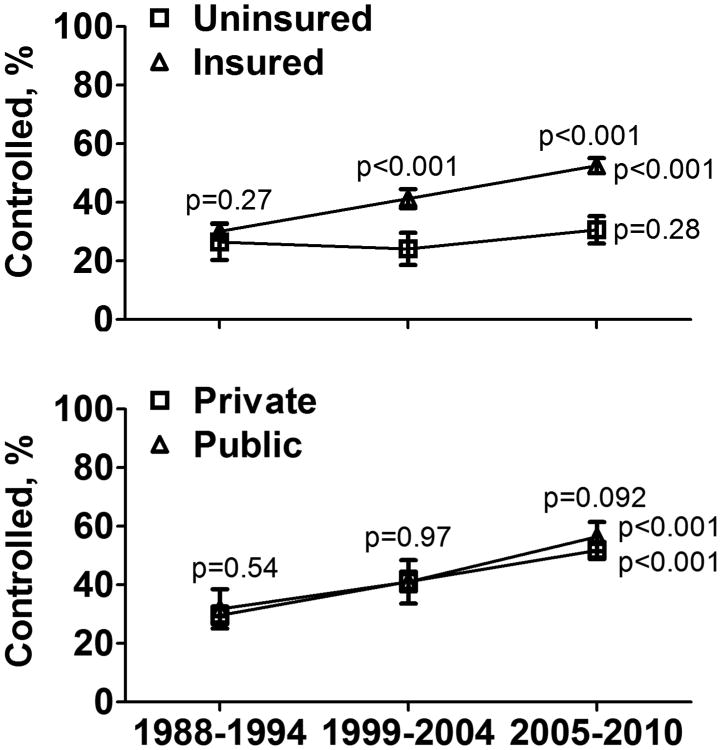
Figure 1.
Hypertension control is shown for the three NHANES time periods in uninsured and insured patients (left) and for publicly and privately insured patients (right).P-values over time periods compare the two groups during that time interval. P-values to the right of 2005–2010, indicate a significant change for the group designated over the 3 NHANES time periods.

